4 results
Easter Common Core 6.SP.B.4 resources
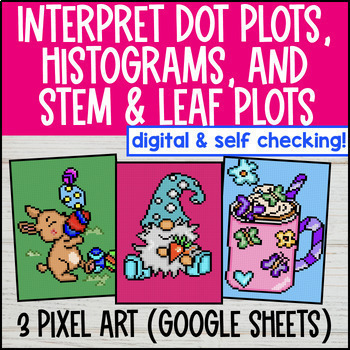
Dot Plots, Histograms, Stem-and-Leaf Plots Digital Pixel Art | Data & Statistics
Take interpreting plots practice to the next level with pixel art! Students practice interpreting dot plots, histograms, and stem and leaf plots across 3 pixel art activities with 36 problems total. It's a perfect addition to your data & statistics unit.These self-checking Google Sheets give students instant feedback. Incorrect answers are highlighted in red, and correct answers turn green and unlock parts of a mystery picture. They’re easy to assign, keep students engaged, and free up your
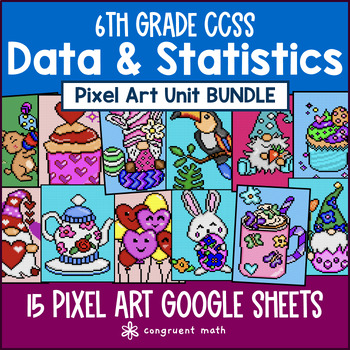
Data & Statistics Pixel Art Unit BUNDLE | 6th Grade CCSS
Students practice data & statistics including classifying statistical vs. non-statistical questions, classifying categorical vs. numerical data, identifying shapes of distribution, interpreting data in dot plots, histograms, stem-and-leaf plots, and box plots, measures of center (i.e. mean, median, mode), and measures of spread and variability (i.e. range, interquartile range, mean absolute deviations) with this 6th Grade CCSS Data and Statistics Pixel Art Unit Bundle. Contains 6 products wi
Box and Whisker Plots Digital Pixel Art | Range Interquartile Median Variability
Take box and whisker plots practice to the next level with pixel art! Students practice interpreting box and whisker plots (i.e. finding range, median, interquartile range) and calculating 5-number summaries (i.e. finding minimum, q1, median, q3, maximum) across 2 pixel art activities with 32 problems total. It's a perfect addition to your data & statistics unit.These self-checking Google Sheets give students instant feedback. Incorrect answers are highlighted in red, and correct answers tu
Subjects:
Grades:
5th - 7th
Jellybean graphing Common Core Fun for Easter or Spring Math
http://www.mycutegraphics.com for graphics.
I bought individual boxes of jellybeans for my class, but you could just create sample sizes from a large bag to use. It was more expensive to do it my way.... but easier in the long run.
I had students predict how many jelly beans were in each box, then record the actual number. (this could be graphed as well)
Students create their personal graph, then work in a group to combine numbers and create a group graph. Focus on scale needed to graph
Grades:
1st - 7th
Types:
Showing 1-4 of 4 results


