184 results
High school statistics laboratories for ESL-EFL-ELL
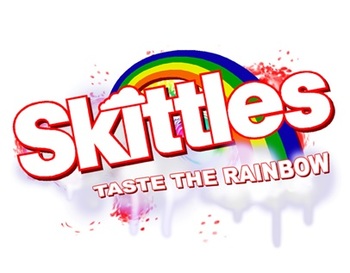
Candy Probability: Discovery of EXPERIMENTAL vs. THEORETICAL Probability
Middle Schoolers LOVE probability!
This is a GREAT lesson around Halloween when the kids are already hyped up on sugar and want to 'talk' to their classmates.
This activity allows the students to DISCOVER the differences between EXPERIMENTAL and THEORETICAL probability and connect it to everyday experiences. The probability lesson lends itself to fractions, decimals, percents, data collection, rational & irrational numbers, statistical graphs (box and whiskers, frequency tables...), measu
Subjects:
Grades:
5th - 9th
Types:
Relative Dating | Digital Lab Activity | Editable
In this Google Slides™ digital lab activity, the students will infer the logical sequence of geologic events and establish a relative age for a series of rock layers for 12 locations. It includes three vocabulary pages, twelve different outcrops, a summary slide where the students reconstruct the geologic history of a region, and discussion questions (NYS Regents questions). This is an interactive lab activity with drag & drop features.ESL Strategies: This lab activity is scaffolded for Engl
Grades:
7th - 10th
CCSS:
NGSS:
MS-ESS1-4
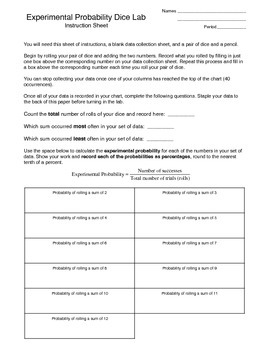
Experimental Probability Activity (dice lab)
In this activity students work with a partner to roll a pair of dice (many times) and record the sum of the dice in a data collection sheet. Once the data has been collected the students are walked through the process of calculating the experimental probability for each sum and then the theoretical probability for each sum and are asked questions about the differences they find between the values. Students also make a bar graph using the percentages for theoretical probability and can visually s
Subjects:
Grades:
7th - 11th
Types:
Theoretical vs Experimental Probability Lab (includes making predictions)
This is a fun, student-centered activity in which students working with a partner will conduct an experimental lab tossing 2 coins. After completing the lab, they will draw conclusions based upon the results of the activity concerning the difference between theoretical and experimental probability. Then they use experimental probability to make predictions. I have included the lab activity, a follow-up worksheet which can be used to engage student discussion after the lab, and a worksheet for
Subjects:
Grades:
6th - 9th
Types:
The Doppler Effect - Evidence for the Big Bang Theory | Digital Lab Activity
In this Google Slides™ digital lab activity, the students will learn how the Doppler effect is used to measure the movement of galaxies and stars in space and why the redshift in the light from distant galaxies is one of the pieces of evidence for the Big Bang Theory. The students will analyze light spectra from galaxies and stars. They will notice a pattern in the relationship between the position of the absorption lines with respect to the red end of the electromagnetic spectrum and the distan
Subjects:
Grades:
8th - 11th
Types:
CCSS:
NGSS:
HS-ESS1-2
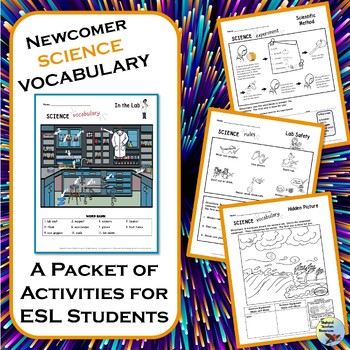
ESL Newcomer Activities Introduction to Science Vocabulary
Give your beginner or newcomer English Language Learners (ELL) multiple exposure to science vocabulary, lab safety, the scientific method, and experiment procedure. Use the vocabulary and writing activities to introduce and reinforce vocabulary and science concepts.Research shows students need 8-12 exposures to new vocabulary. This no prep unit will give your students plenty of practice in acquiring and using science vocabulary. Your students can keep the anchor charts/study guides handy as t
Subjects:
Grades:
4th - 12th
CCSS:
Stream Erosion and Deposition | Digital & Editable Lab Activity | NGSS & NYS
In this Google Slides™ digital lab activity, the students will determine the ability of a stream to erode and deposit sediments depending on the water velocity. They will learn about erosional and depositional stream features such as V-shaped valleys, deltas, flood plains, and meanders as they take a virtual field trip and follow a river from the mountains to the ocean. This is an interactive lab activity with drag & drop features, videos, stream tables demos, and graphing. Learning Objectiv
Grades:
8th - 11th
Types:
CCSS:
NGSS:
HS-ESS2-5
Correlation of Rock Layers using Index Fossils | Digital Lab Activity | Editable
In this Google Slides™ digital lab activity, the students will correlate different outcrops using the law of superposition. The lab includes a vocabulary page, 9 different stratigraphic columns, and 4 slides of discussion questions. The students will look for patterns in rock layer sequencing, composition, index fossils, and volcanic ash layers to identify relationships between rock outcrops found at different locations and reconstruct stratigraphic columns. This is an interactive lab activity w
Grades:
7th - 10th
Types:
CCSS:
NGSS:
MS-ESS1-4
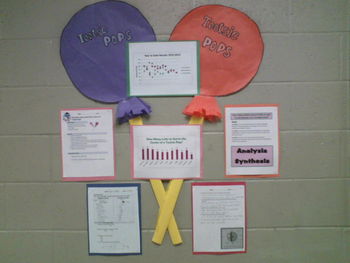
How Many Licks to the Center of a Tootsie Pop? Statistics!
Looking for novel way to get your middle school students excited about math and statistics?!
This file contains everything you need to conduct the experiment (except the Tootsie Pops!) that answers the age old question "How many licks does it take to get the center of a tootsie pop?" The lesson covers mean, median, mode, range, outliers, tables, graphs, box and whisker plots, data collection, pre and post discussion questions, experimental procedures, and student reflection. I also provided a s
Subjects:
Grades:
6th - 9th
Types:
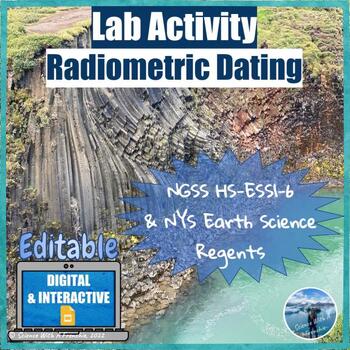
Radiometric & Absolute Dating of Rocks | Digital Lab Activity | Editable | NGSS
In this Google Slides™ digital lab activity, the students will use absolute dating, also known as radiometric dating, to find the age of fossils and rocks samples. They will calculate the half-life of a radioactive isotope, graph the radioactive decay of a radioactive isotope and its stable product, and analyze radioactive decay curves to find the age of igneous rock samples. This is an interactive lab activity with a link to an online radioactive decay simulation and drag & drop features. W
Grades:
8th - 11th
CCSS:
NGSS:
HS-ESS1-6
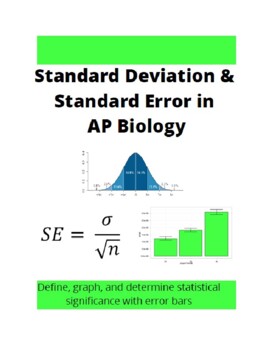
Standard Error and Standard Deviation in AP Biology
Statistics is one of those components in AP Biology that is brand new to students.Without a proper introductory lesson to standard error and standard deviation, students can struggle with this all year. Fortunately, this lesson truly walks your students through the process of defining standard deviation and error, applying the concept of error bars with statistical analysis, and graphing data with error bars to make their own statistical analysis. A PowerPoint is included as well to guide the le
Subjects:
Grades:
11th - 12th
Types:
Geologic History Bundle | Editable Notes, Lab & Review Activities | NYS Regents
This bundle covers everything your students need to know about Geologic History for the New York State (NYS) Regents exam. It includes guided notes with practice questions, teacher presentations, and 3 digital and interactive lab activities. The students will learn about relative and absolute dating, index fossils, the correlation of rock layers, and the geologic time scale. They will also learn how to read and use pages 1, 2, 3, 8, and 9 of the Earth Science References Tables (ESRT) as well as
Grades:
8th - 11th
Types:
CCSS:
NGSS:
MS-ESS1-4
, HS-ESS1-6
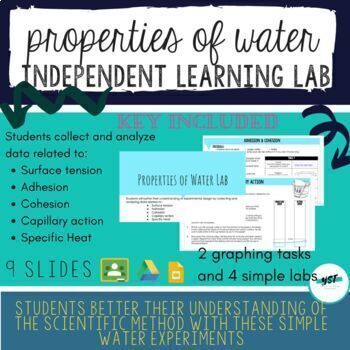
Properties of Water Virtual Lab
Students will better their understanding of experimental design by collecting and analyzing data related to: Surface tensionAdhesion CohesionCapillary actionSpecific HeatThere is a pull tab with background information for students to rely on if they need a refresher or haven't learned this material. This is an excellent experiment to have students complete from home, either due to distance learning or if a student is absent. A list of common household items is included for students to gather wha
Subjects:
Grades:
3rd - 12th
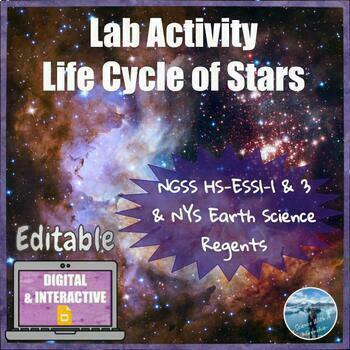
Life Cycle of Stars | Digital Lab Activity | Editable | NGSS
In this Google Slides™ digital lab activity, the students will use a simulation to investigate the life cycle of stars based on their initial masses. They will notice a relationship between the mass of a star and how it evolves. This is an interactive lab activity with a link to an online simulation (Star in a Box), a PBS video, and drag & drop features. The students will use the online simulator to create a model that shows the cycle stars go through, from the formation of the star to its d
Subjects:
Grades:
8th - 11th
Types:
CCSS:
NGSS:
HS-ESS1-3
, HS-ESS1-1
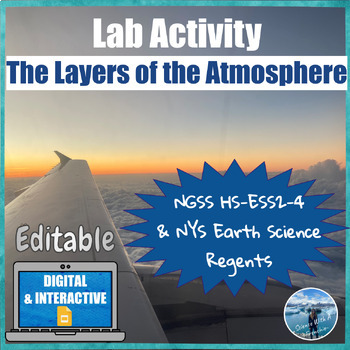
Layers of the Atmosphere | Digital Lab Activity | Editable | NGSS
In this Google Slides™ digital lab activity, the students will explore the properties of Earth’s Atmosphere. They will understand how the atmosphere is divided into layers based on temperature changes at different altitudes. They will describe the structure of Earth’s atmosphere and investigate temperature, density, and pressure changes in the different layers. In addition, they will identify the meteorological and astronomical phenomena that occur in each layer of Earth’s atmosphere. This is an
Grades:
8th - 10th
CCSS:
NGSS:
HS-ESS2-4
, MS-ESS2-5
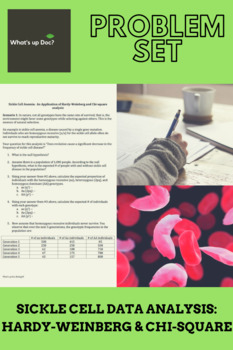
Sickle Cell Data Analysis: Hardy-Weinberg and Chi-Square
Want a great way to convert the "traditional" Hardy-Weinberg lab into a data problem set? Here it is! This is ideal for very small classes, where sample size could be an issue, busy classes, where you may need this for additional at-home practice, or very large classes, where the swapping of H-W cards could get too messy.Included is the full data problem set and teacher pages with the answer key.This data problem set covers:-genotypes and phenotypes-the Hardy-Weinberg equation, with application
Subjects:
Grades:
10th - 12th, Higher Education
Types:
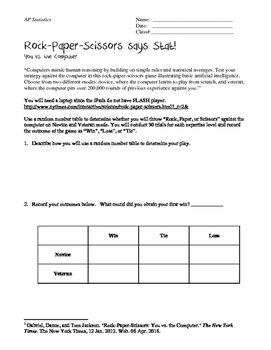
Rock, Paper, Scissors says Stat: A Chi-Square Lab
Students will utilize a Rock, Paper, Scissors website provided by the New York Times to determine whether the computer throwing Rock, Paper, Scissors is truly random. Students are asked to play the game 30 times in both modes. In addition, students are asked to call back ideas of simulation and probability to review previous learned concepts in preparation for the AP Exam to eliminate the confounding variables associated with human behavior.Please find an updated link to the simulator here: ht
Subjects:
Grades:
9th - 12th, Higher Education
Types:
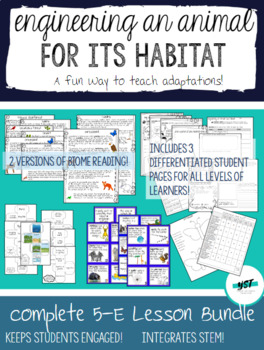
Engineering an Animal for a Habitat Complete 5E Adaptation Lesson Plan Bundle
This lesson plan takes all the hard work out of a fun way to teach adaptations! You just have to figure out which differentiated worksheet works best for your students, print, and be prepared for an exiting day of active learning. This 5E lesson plan includes everything for you to successfully Engage, Explore, Explain, Elaborate, and Evaluate without giving a lecture and incorporates STEM into your class as students design models of the animal they engineered. Also includes a follow up Extension
Subjects:
Grades:
3rd - 12th
Types:
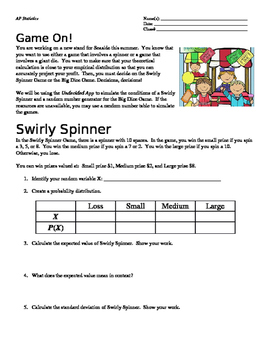
Game On! Hypothesis Testing: 1-Sample t-Test for Means Lab
This lab asks students to apply concepts of 1-sample t-test of means in a real world context. They are able to play/simulate games and determine if their theoretical calculation is accurate.
This lab integrates hypothesis testing based on two carnival games. Spiraling expected value and random variable topics from previous chapters will help themto prepare them with a "big picture" when it comes to the AP Statistics Exam.
(For the high flyers: It also asks students to develop of higher orde
Subjects:
Grades:
10th - 12th
Types:
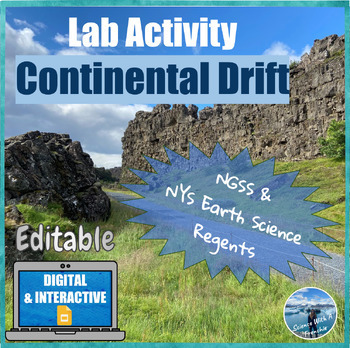
The Theory of Continental Drift | Digital Lab Activity | Editable | NGSS
In this Google Slides™ digital lab activity, the students will analyze and interpret data on the distribution of fossils and rocks, and continental shapes to provide evidence of past plate motions and continental drift. This lab activity follows the 5E model with the Engage, Explore, Explain, Elaborate, and Evaluate phases. It is an interactive lab activity with drag & drop activities, video clips, and Regents questions. The key is included.ESL Strategies: This lab activity is scaffolded for
Grades:
8th - 10th
CCSS:
NGSS:
MS-ESS2-3
, HS-ESS1-5
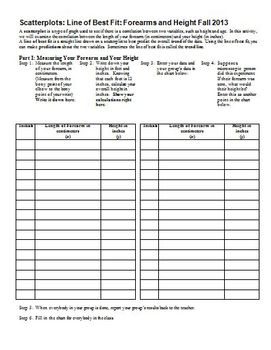
Scatterplots Linear Regression Line of Best Fit Forearms & Height (Editable)
After teaching my students about scatterplots, correlation, and the line of best fit, I take a day for them to do a hands-on lab, in which they measure their height (in inches) and their forearm length (from the tip of their elbow, to the bony point on their wrist), and we plot the class data, write the equation of the line of best fit, and then use the equation generated both forwards and backwards. They will need 45 minutes to an hour to do this in class.
I have found that if the students br
Subjects:
Grades:
7th - 12th
Types:
The Moon and its Effect on Tides | Digital Lab Activity | Editable | NGSS
In this Google Slides™ digital lab activity, the students will analyze tidal data to understand how the moon affects Earth’s ocean high and low tides. First, they will observe the tidal phenomenon in a day to spark their curiosity. Then, they will graph the tidal change over 4 days and answer analysis questions based on their graph. The students will use guided questions and animations to explain the origin of tides due to the gravitational attraction of the Moon and Sun. Finally, they will use
Grades:
8th - 10th
Types:
CCSS:
NGSS:
MS-ESS1-1
The Phases of the Moon | Digital Lab Activity | Editable | NGSS
the students will investigate the actual and apparent motions of the Moon and determine the different phases of the Moon as it moves throughout our sky over a month. First, they will observe the cycle of phases phenomenon over a month to spark their curiosity. Then, they will use an online simulation to analyze the position of the Earth, Sun, and Moon as viewed from space and by an observer on Earth for different phases of the Moon. This is an interactive lab activity with a link to an online si
Subjects:
Grades:
8th - 11th
Types:
CCSS:
NGSS:
MS-ESS1-1
Matter Molecules Energy Ice Cream Lab Reading Cloze Notes NGSS PS1.A PS3.A
I have done this lab since 2000 and it is the most memorable lab that I do. I have former students that are now adults that remember this lab. I don’t buy any of the ingredients, we discuss it days before and the students get in groups to decide who brings in what ingredients. On the day of the lab I have students bring in their materials in the morning and I have 5 different coolers for my five different periods. I only have them place what needs to stay cold in the cooler and rest of the ingre
Subjects:
Grades:
4th - 9th
NGSS:
MS-PS3-4
, MS-PS1-4
, MS-PS1-2
, MS-PS1-1
Showing 1-24 of 184 results


