47 results
4th grade statistics interactive whiteboards under $5
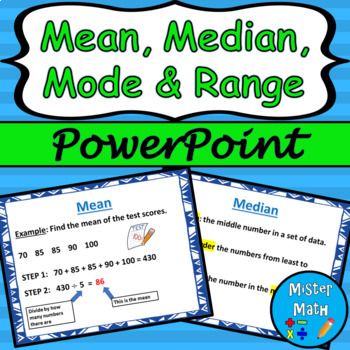
Mean, Median, Mode & Range PowerPoint Lesson
This is a PowerPoint Lesson to assist students in learning about finding the mean, median, mode, and range of data sets. The PowerPoint includes key vocabulary, as well as an example for each skill. Plenty of real-life examples are included to give students ample opportunities to connect the skills to the real world. The presentation also comes fully animated, with animations triggered by mouse click (or presentation pointer!)This PowerPoint lesson is also part of a BUNDLE that includes a guided
Subjects:
Grades:
3rd - 6th
Also included in: Mean, Median, Mode & Range PPT and Guided Notes BUNDLE
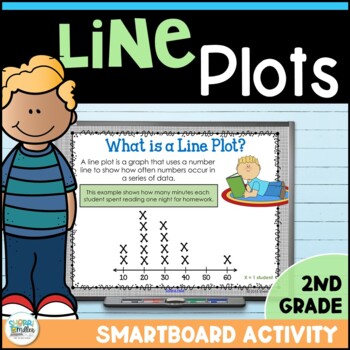
Line Plots Graphing Smartboard Digital Lesson & Student Booklet
Line plots can be a difficult concept for students. This Smartboard lesson and printable booklet will provide you and your students with several activities to practice creating line plots and answering questions about them. The student booklet will keep students engaged during the lesson! You must have Smart Notebook software to open this file. You may also be interested in these other resources:Measurement Digital Escape Room - Escape the Spaceship using Google Apps Geometry Angles Digital Es
Subjects:
Grades:
4th - 5th
Open-Ended Math Questions - Chance and Data
This product targets chance, data, graphing and probability by asking the students open ended questions about the topic. This provides an entry point for all students and allows the teacher to quickly gauge the varying levels of knowledge and understanding in the classroom. The PDF is intended to be displayed on an interactive whiteboard and students could answer the questions orally, on mini whiteboards or on the included student response sheet. The student response sheet could also be used as
Subjects:
Grades:
3rd - 5th
Also included in: Open Ended Math Questions BUNDLE - Over 65 Different Questions!
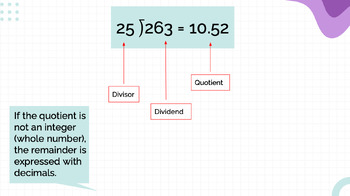
Order of Operations, Multiplying Decimals, Remainders, Graphs, Google Slides
Google Slides for different math topics: - Order of Operations (examples, breakdown of order) - Multiplying Decimals (Step by step guide and examples to practice)- Dividing Natural Numbers with a Decimal Remainder- Statistics (how to make a survey question, organize into data table, features of a graph, average problem)
Subjects:
Grades:
2nd - 8th
Mean, Median, Mode, Range Smartboard Slides Lesson Measures of Central Tendency
You'll LOVE this great Data Measures-of-Central-Tendency: Mean, Median, Mode, & Range Smartboard-Slides-Lesson. Your students will LOVE this interactive smartboard lesson that teaches and practices Mean, Median, Mode, and Range, along with a Card Game for practice. YOU GET 28 slides total, a very comprehensive and complete lesson. You'll enjoy using this great smartboard lesson year after year. WARNING: You MUST have SMART Technologies SMART software, and a SMARTBOARD to teach from, to effec
Subjects:
Grades:
4th - 7th
Probability ActivInspire Flipchart
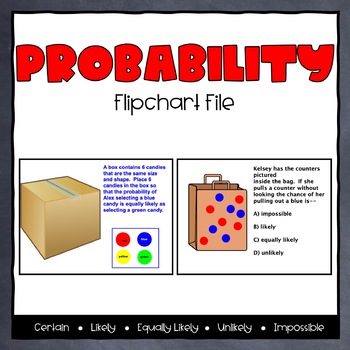
This flipchart has 33 slides that have various types of practice with understanding probability. This flipchart introduces the concept of probability as chance and defines the 5 main descriptor words associated with probability (certain, likely, equally likely, unlikely, and impossible). It reinforces the concepts with examples. It also reviews the probability words and has several multi-step, technology-enhanced examples for student practice.The flipchart is designed for whole-group but coul
Subjects:
Grades:
2nd - 4th
Types:
Dot Plots and Data Distribution Displays Smartboard Slides Lesson
Dot-Plots and Data-Distribution Smartboard-Slides-Lesson covers Data-Distribution and Creating Dot-Plots. Lots of practice problems provided. You'll love using this Smartboard Lesson to teach from year after year! WARNING: You MUST have SMART Technologies SMART software, and a SMARTBOARD to teach from, to effectively download, open and use this Interactive Smartboard Lesson. Go to https://legacy.smarttech.com/en/products/education-software/smart-learning-suite/download/trial to download a free t
Subjects:
Grades:
4th - 7th, Staff
Histograms Smartboard Lesson Data Displays Graphs Graphing
TERRIFIC Histograms-Smartboard-Slides-Lesson covers what a Histogram is, what they look like, features specific to Histograms, and lots of interactive practice for students to create Histograms and be able to read Histograms and find answers. This smartboard lesson also combines activities to practice Histograms. Your students will LOVE learning about Histograms with this Smartboard Lesson. You'll use this year after year to teach Histograms. Created by Tricks and Treats for Teaching. WARNING: Y
Subjects:
Grades:
4th - 6th
What is Average? Lesson 2- Introducing mean
This lesson and activity packet contains everything you need to help your students master the strategies to determine the mean of a data set. Through real-world practice, your students will investigate each concept and apply their learning. This activity includes interactive SMARTBoard slides, vocabulary handouts, guided note-sheets, a Socrative exit slip, and class and homework options. This lesson can be used individually, or as a follow up to “What is Average? - Mean, Median and Mode.” D
Subjects:
Grades:
4th - 8th
Median Mode Range Smartboard Slides Lesson Measures of Central Tendency
Incredible ~ 31 slides ~ Smartboard-Slides-Math-Lesson over Median, Mode, and Range (Measures of Central Tendency). This is EVERYTHING you need to teach these three measure-of-central-tendencies. Students will enjoy the interactive slides where they work problems at the Smartboard. Please be sure to see my other smartboard lesson on Finding the Mean, Average. You'll enjoy using this resource year after year. WARNING: You MUST have SMART Technologies SMART software, and a SMARTBOARD to teach from
Subjects:
Grades:
4th - 7th, Staff
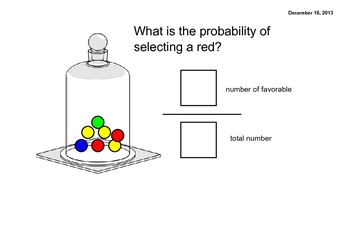
Probability Smartlesson
This activity is designed to be the initial lesson when introducing the vocabulary associated with probability. It allows students to practice matching outcomes with vocabluary terms, and also leads to how to express probability using a fraction. Each slide is interactive and will encourage great conversations full of academic vocabulary!
Subjects:
Grades:
4th - 6th
Virginia SOL Review TEIs Math Grade 6 (2009 SOLs)
Virginia SOL Review TEIs Math Grade 6
Technology Enhanced Items
Subjects:
Grades:
4th - 6th
Types:
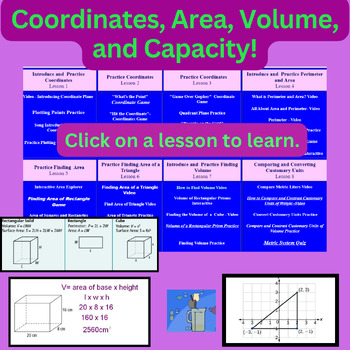
EXPLORING COORDINATES, AREA, VOLUME, CAPACITY! Supports Virtual Learning!
Access practical strategies for learning Coordinate, Area, Volume, and Capacity concepts tailored to diverse learning styles with just one click. Approaches include interactive games, videos, and PowerPoints.This product is a website designed to align with the Coordinate, Area, Volume, and Capacity concepts taught in Unit 9 of Everyday Math curricula for 5th grade. However, it can quickly adapt to other publishers and grade levels that cover similar skills.This resource provides activities for a
Subjects:
Grades:
4th - 6th
Types of Graphs and Their Uses Flip Chart
This lesson discusses the definition of various types of graphs and their uses. Included topics: bar graphs, double bar graphs, line graphs, circle graphs, pictographs, and more.
Subjects:
Grades:
4th - 8th
Types:
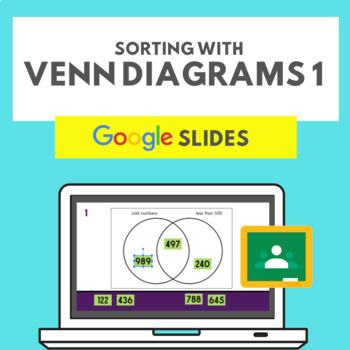
SORTING WITH VENN DIAGRAMS 1 - GOOGLE SLIDES
Students are presented with three types of Venn Diagrams and a set of data. Slides are interactive, allowing students to move the numbers into the correct position on the diagrams.
Subjects:
Grades:
3rd - 5th
Represent and Interpret Data Using Line Plots - 4.MD.4
Read and draw line plots, and use the data to answer basic questions. Scaffolded lesson provides for classroom differentiation. Can be used as a lesson leader, guided practice, independent practice, for cooperative learning and math centers, or as an assessment. Use with smartboard, projector, computer, pad or as printable. Lesson is complete - NO PREP.
Objectives:
- Interpret line plots
- Given data sets create line plots
- Answer questions using data in line plots
Includes 6 practice pages and
Subjects:
Grades:
3rd - 6th
CCSS:
What is Average? Lesson 1 - Median, Mode, and Range
This lesson and activity packet contains everything you need to help your students master median, mode and range. Through real-world practice, your students will investigate each concept and apply their learning. This activity includes interactive SMARTBoard slides, vocabulary handouts, guided note-takers, and class and homework options. Dive in to this fun investigation of important math concepts.
Be sure to check out my other great lessons and worksheets and let me know what you t
Subjects:
Grades:
4th - 8th

Reviewing Data (Median, Mode, and Range)
This Smart Board lesson was designed for third graders as a review of Measures of Central Tendencies. The lesson includes a review of maximum and minimum value, range, median, and mode. Students review the material together as part of the Smart Board lesson and then work in a cooperative group to practice. The lesson includes directions for the cooperative activity and the necessary cards.
Subjects:
Grades:
2nd - 4th
Reading & Creating Circle Graphs Flip Chart
This lesson involves reading and creating circle graphs. It includes key vocabulary, steps to reading a circle graph, and how circle graphs are created. It also includes examples of open response questions for reading and interpreting circle graphs.
Subjects:
Grades:
4th - 8th
Types:
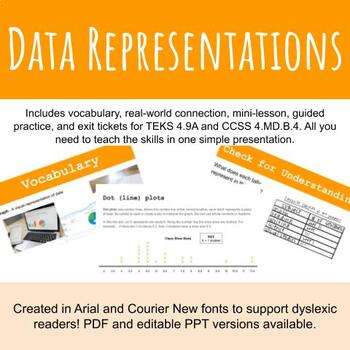
Data Representations PowerPoint Slides (PDF Form)
These slides introduce your students to TEKS 4.9A & D/CCSS 4.MD.B.4, data representations. Slides include the learning goal/success criteria, real-world connections, vocabulary, a mini lesson with checks for understanding and guided practice, and end with printable exit tickets (open-ended format and multiple choice). The slides introduce basic concepts and then add rigor to the questions to get your students thinking on a higher level.Use these slides whole group, small group, or as a tool
Subjects:
Grades:
4th - 5th
CCSS:
Also included in: Data Slides Bundle

Math SMARTboard Lesson: Probability Predict an Outcome
This smart board lesson was created to guide my instruction with my 3rd graders on how to predict an outcome using probability. Included in this lesson is an essential question, lots of interactive student practice, and a total of 8 slides.
Subjects:
Grades:
2nd - 5th
SMARTBOARD lesson on ratios, fractions, percentages, and more
This smartboard lesson showcases how ratios, fractions, decimals, probabilities, and percentages are all similar ways of looking at the same thing. Each page has a spinner with a different amount of colored slices on it. As you go from many slices to fewer slices, the chance of correctly predicting what color comes up gets much better.
Have students 'bet' classroom rewards like tickets or candy to see who can correctly guess the most colors as you go through the lesson.
Subjects:
Grades:
3rd - 12th, Adult Education
Data Analysis & Probability: Memory Match Game - NOTEBOOK Gr. 3-5
**THIS is a SMART Notebook Version**This is a Memory Match Game Mini. It is just one activity from the full lesson plan Data Analysis & Probability - NOTEBOOK Gr. 3-5.About this Resource: In this Memory Match Game mini, 6 matching pairs of data analysis and probability questions are hidden in the puzzle. This mini is great for comprehending the data analysis and probability concepts covered in the Five Strands of Math for grades 3-5.***********************************************************
Subjects:
Grades:
3rd - 5th
Types:
Data Analysis & Probability: Board Game - NOTEBOOK Gr. 3-5
**THIS is a SMART Notebook Version**
This is a Board Game Mini. It is just one activity from the full lesson plan Data Analysis & Probability - NOTEBOOK Gr. 3-5.
About this Resource:
In this Board Game mini, 16 data analysis and probability questions are split between two teams in the form of multiple choice questions. This mini is great for comprehending the data analysis and probability concepts covered in the Five Strands of Math for grades 3-5.
**********************************
Subjects:
Grades:
3rd - 5th
Types:
Showing 1-24 of 47 results


