37 results
2nd grade Common Core 3.MD.B.4 interactive whiteboards
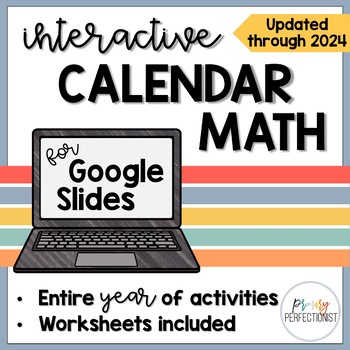
2023-2024 Interactive Calendar Math Program for GOOGLE Slides: Distance Learning
Calendar Math for Google Slides / Google Classroom provides an entire year of interactive calendar activities PLUS a spiral review of Common Core math skills for 2nd, 3rd, and 4th grade! Worksheets, a video tutorial, and teacher's guide are included in this best-selling product._______________________________________________________________________________________º Interactive Calendar Math for Google Slidesº Grades 2, 3, and 4º 30 different pages of math activitiesº No more waiting! This is now
Subjects:
Grades:
2nd - 4th
Everyday Math: Grade 3: Units 1-9 BUNDLE
This product is a bundle of Everyday Math: Grade 3 Units 1-9, with a 33% discount! They are interactive slides with games, activities, and hands on lessons that go well with Pear Deck. Unit 1: Math Tools, Time, and Measurement Unit 2: Number Stories and ArraysUnit 3: Operations Unit 4: Measurement and Geometry Unit 5: Fractions and MeasurementUnit 6: More OperationsUnit 7: FractionsUnit 8: Multiplication and DivisionUnit 9: Multidigit Operations
Subjects:
Grades:
2nd - 4th
Reveal Math for Grade 3
These Google Slides are intended to supplement Reveal Math for Grade 3. Unit 2 - 18 Lessons and 185 Slides in Total Place ValueNumber FormsComparing NumbersRoundingEstimatingAdditionSubtractionUnit 3 - 8 Lessons and 66 Slides in TotalEqual GroupsEqual SharingRelate Addition and MultiplicationFind the Unknown NumberUnit 4 - 6 Lessons and 53 Slides in TotalMultiplication FactsUnit 5 - 7 Lessons and 55 Slides in TotalDistributive Property of MultiplicationProblem Solving with ArraysMultiplication F
Measurement & Data: How To: Read a Ruler Anchor Chart (English & Español)
CCSS.MATH.CONTENT.2.MD.A.1Measure the length of an object by selecting and using appropriate tools such as rulers, yardsticks, meter sticks, and measuring tapes.CCSS.MATH.CONTENT.3.MD.B.4Generate measurement data by measuring lengths using rulers marked with halves and fourths of an inch. Show the data by making a line plot, where the horizontal scale is marked off in appropriate units— whole numbers, halves, or quarters.This is a skill that seems to get overlooked or glossed over. I am surprise
Subjects:
Grades:
1st - 12th
Also included in: Bundle: Everything Elementary Math Anchor Charts (English & Español)
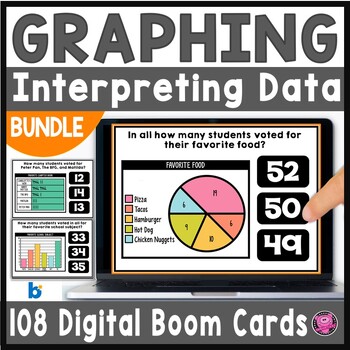
Graphing and Date Analysis Reading and Interpreting Graphs and Data
Ready to challenge your second and third grade students understanding of interrupting data on different types of graphs? This DIGITAL Boom Cards Interpreting and Analyzing Graphing BUNDLE gives you read-to-teach activities to help students understand beginning concepts and strategies needed to interpret, read, and analyze data on tally charts, pie charts, pictographs, vertical and horizontal bar graphs, and line plots!Students will use these graphing and data activities to problem solve using ad
Grades:
2nd - 4th
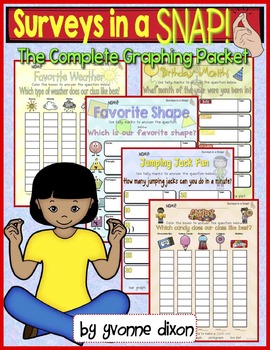
Surveys in a Snap! {Graphing Fun}
New...Surveys in a Snap (The Complete Graphing Packet)! This teaching resource is ready to use for survey fun and graphing for your own classroom! Students will enjoy reading and completing the survey questions then using the data collected to create and design four types of graphs: bar graphs, picture graphs, pictographs, and line plots. Included are 17 surveys in color or with black and white options to save ink. They are ideal for projecting on a Smartboard or great for printing to collec
Subjects:
Grades:
PreK - 3rd
Reveal Math Grade 3 Unit 12
These Google Slides are intended to supplement Reveal Math for Grade 3 Unit 12. Measure to Nearest Half Inch Day 1 - 6 SlidesMeasure to Nearest Half Inch Day 2 - 9 SlidesMeasure to Nearest Quarter Inch Day 1 - 6 SlidesMeasure to Nearest Quarter Inch Day 2 - 6 SlidesPicturegraphs - 10 SlidesBar Graphs - 9 SlidesLine Plot - 7 SlidesMeasure and Make a Line Plot Day 1 - 7 SlidesMeasure and Make a Line Plot Day 2 - 4 Slides
Subjects:
Grades:
2nd - 4th
Everyday Math: Grade 3 Unit 9: Multidigit Operations
This product is the ninth unit of Everyday Math. It is interactive and engaging. It has games, extension activities, and lessons for each day. It also works well with the Pear Deck program.Contents Include:Lesson 1: Playing Product Pile Up Lesson 2: Multiply and Divide with Multiples of 10Lesson 3: Using Mental Math to Multiply Lesson 4: Exploring Elapsed Time, Squares, and Bridges Lesson 5: Multidigit Multiplication Lesson 6: Packing ApplesLesson 7: The Length of a Day Project Revisited End of
Subjects:
Grades:
2nd - 4th
Also included in: Everyday Math: Grade 3: Units 1-9 BUNDLE
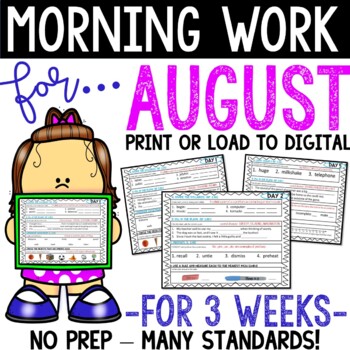
BACK TO SCHOOL AUGUST MORNING WORK FOR 3 WEEKS 2ND 3RD GRADE PRINTABLE DIGITAL
THIS IS SO AWESOME FOR 2ND/3RD GRADE STUDENTS IN THEIR FIRST MONTH OF INSTRUCTION.THIS IS A PDF AND POWERPOINT FILE WITH 3 WEEKS OF DAILY MORNING WORK.IT WOULD BE PERFECT TO ASSIGN ON SEESAW, CAN BE PRINTED, OR GIVEN ON A SMART BOARD!!!!THIS IS ALSO A GREAT TEST PREP.HERE IS WHAT EACH WEEK INCLUDES:WEEK #1: NOUNS, PROPER/COMMON NOUNS, SYLLABLES, 3D OBJECTS, VOCABULARYWEEK #2: PREFIXES, SYLLABLES, MEASUREMENTWEEK #3: ABC ORDER, LONG VOWELS, WORD PROBLEMS/NUMBER LINES*FOLLOW ME ON FACEBOOK TO S
Grades:
2nd - 3rd
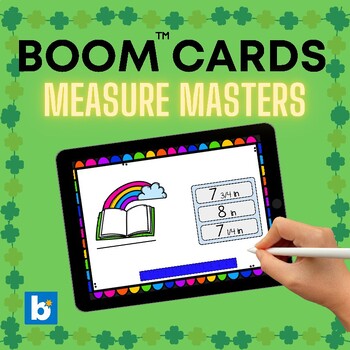
Boom Cards: Measure Masters
Includes measuring to: 1 inch, 1/4 inch, and cm.Equipped with a virtual ruler, students can actively participate in the learning process by dragging the ruler to measure various objects accurately in a fun and engaging way.Each measurement task is followed by a multiple-choice question where students will apply their newly acquired skills.Boom Cards are great for small group and whole group learning! Keep tabs on individual student progress. Teachers and parents can monitor performance, identify
Subjects:
Grades:
2nd - 4th
CCSS:
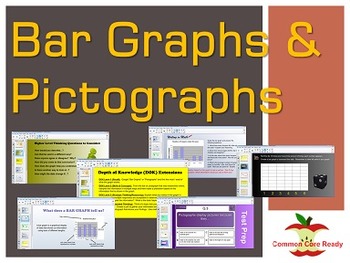
Bar Graphs & Pictographs for Measurement / Data for the SMART Board
Bar Graphs & Pictographs for Measurement / Data for the SMART BoardIn this SMART Board Common Core Bar & Pictograph lesson, students will create and draw a scaled picture graph and a scaled bar graph to represent a data set with several categories. Solve one- and two-step “how many more” and “how many less” problems using information presented in scaled bar graphs. For example, draw a bar graph in which each square in the bar graph might represent 5 pets.This interactive SMART Board less
Subjects:
Grades:
2nd - 4th

Measurement by the Inch Boom Cards (Distance Learning)
In this simple measurement deck, students will practice measurement of length by reading a ruler. They will tell the length of an object in inches. This deck has been divided into two parts:A- Read the ruler and select the correct length.B - Read the ruler and type the correct length ( students can use standard or word form with the numbers)Children can play on any type of technology platform( laptop, tablet, desktop). You will need internet connection to play.The great thing about Boom Learning
Subjects:
Grades:
1st - 4th
CCSS:
Also included in: All Year Math Boom Cards MEGA Bundle
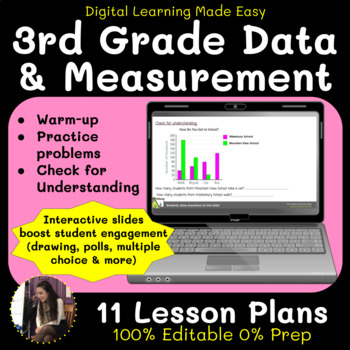
3rd Grade Measurement & Data BUNDLE
This unit consists of 11 lesson plans covering 3rd grade measurement and data concepts.SWBAT:- Interpret bar graphs and double bar graphs- Interpret scaled pictographs- Interpret Line Plots with whole numbers and nearest half-inch intervals- Measure length to the nearest quarter inch- Determine the best measurement tool for measuring lengths of objects- Solve measurement problems greater than one footEach lesson plan includes:Spiral review warm upStudent-friendly objectiveStudent centered tasksT
Subjects:
Grades:
2nd - 4th
Types:
CCSS:
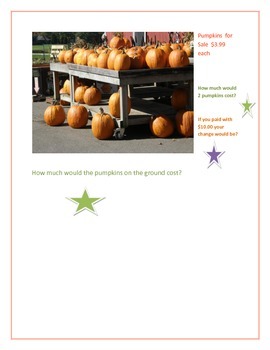
Fall Math using the Smart Board
Fall Math is a set of eleven activities for 3rd grade common core. This could also be used as enrichment for grade 2 or review for students in grade 4. Each page has one of my original photos(mainly pumpkins and fall trees) from the New England area with multiple activities per page. Activities include telling time to the minute, measurement, multiplication, using bar graphs, fractions, and multiple step word problems. Each page has the answers given with an interactive device so students c
Subjects:
Grades:
2nd - 4th

No Prep Class Made Line Plot with Data Analysis
*NO PREP*COMPLETELY EDITABLE*Slides to make 2 line plots using measurement data as a whole classSlides also include a pre-made line plot with 3 questions to practice analyzing data
Subjects:
Grades:
2nd - 3rd
Also included in: GRAPHING BUNDLE
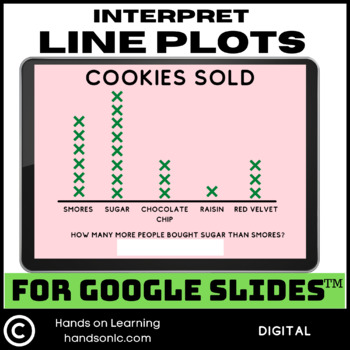
Interpret Line Plots for Google Slides
Line Plots for Google SlidesThese digital task cards for Google Slides are perfect to practice interpreting data on line plots. There are 5 different line plots included in this resource. Each line plot has 5 different questions. Students will answer questions about the data and perform simple addition and subtraction operations.Highlights➼ Digital and Interactive➼ Easy to use➼ Measure candies and make a line plotHow to use this product:This product is made to work with Google Slides. Upon downl
Subjects:
Grades:
2nd - 4th
Also included in: Graphing Bundle Google Slides

Lesson 7: Line Plots with Half-Inches
Today we will interpret and create line plots using half-inches. Lesson Plan Includes:Spiral review warm upStudent-friendly objectiveStudent centered tasksTeacher ModelsCheck for UnderstandingReflection & Takeaways*These Interactive Google Slides are compatible with Pear Deck. Note that using these lesson plans with Pear Deck is entirely OPTIONAL. All lesson plans are fully functional and effective without the Pear Deck Add On. If you choose to use these lesson plans without Pear Deck, just
Subjects:
Grades:
2nd - 4th
Types:
Also included in: 3rd Grade Data Mini Unit: Bar Graphs, Pictographs, & Line Plots
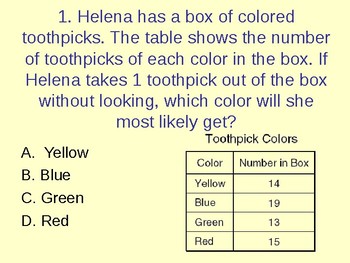
3rd Grade Math Review Powerpoint
This powerpoint would be a great way to start each math class or to fill an extra few minutes here or there. The powerpoint includes a wide range of 3rd grade math questions for review - would be great for whole group review on a SMARTBoard!
40 Slides!
Subjects:
Grades:
2nd - 4th
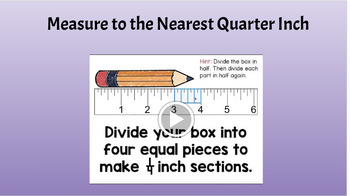
Measure to the Nearest Quarter Inch (Day 1)
This Google Slide can be used with Pear Deck to create an engaging lesson to teach how to measure to the nearest quarter in on a ruler.
Subjects:
Grades:
2nd - 4th
CCSS:
Also included in: Reveal Math Grade 3 Unit 12
FREEBIE! Measuring to the Nearest Quarter Inch (*Distance Learning)
Are you looking to get more technology friendly during math workshop? This Google Classroom ™ activity is specifically made for students who are practicing measuring to the nearest quarter inch.INCLUDED:-Links to download the Google Slides ™-10 Practice Problems WHY PURCHASE?- Get your students to become comfortable with interacting with digital resources- Print less!- Make math centers/workshop less complicated- If you are looking for resources that are standards alignedQUESTIONS/COMMENTS:Don't
Subjects:
Grades:
1st - 4th
CCSS:
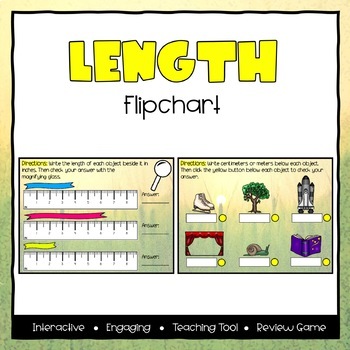
Length ActivInspire Flipchart - Third Grade
This is a Activinspire Flipchart that is designed to work with Activinspire program only.**This file will NOT open in PowerPoint or Smart Notebook. The flipchart has 27 slides that focus on the concept of length, including: - estimating using inches, feet, and yards - estimating using centimeters and meters - measuring with a centimeter and inch ruler - comparing estimates of length to actual measurements Several different examples of each model are given with many ways for students to come to t
Subjects:
Grades:
2nd - 4th
Types:
CCSS:
Also included in: 3rd Grade Math ActivInspire Flipcharts Bundle
Measure and Make a Line Plot (Day 1)
This Google Slide can be used with Pear Deck to create an engaging lesson to teach measuring and making a line plot.
Subjects:
Grades:
2nd - 4th
CCSS:
Also included in: Reveal Math Grade 3 Unit 12
Line Plots
This Google Slide can be used with Pear Deck to create an engaging lesson to teach reading and answering questions about line plots. Intended to supplement Reveal Math Grade 3 Unit 12 Lesson 11.
Subjects:
Grades:
2nd - 4th
CCSS:
Also included in: Reveal Math Grade 3 Unit 12

Grade 3 Data Analysis Instructional Pack
This is my second full instructional pack! Many have asked for my lessons plans and activities to be sold. This is a starter pack! Once I see the feedback from this set and my place value set, I will devote time to make more across all subject areas.
The contents of this ZIP file are listed below. The activities are VA SOL aligned to pictographs, bar graphs, and line plots for grade 3. The activities are also aligned to grade 2 and grade 3 Common Core standards.
This set includes:
-25 pages o
Subjects:
Grades:
2nd - 3rd
Showing 1-24 of 37 results


