29 results
Free Common Core HSS-ID.B.5 resources
FREE EDUCATIONAL WEBSITES LIST 4 ALL GRADES K-12 AND SUBJECTS + TEACHER RESOURCE
Sometimes, you just need a list of websites for everyone. Here it is. FREE EDUCATIONAL WEBSITES Put together by Teach Me, Maria!It takes time to gather this information, figure out the appropriate grade levels, and format, maintain, and update this page. All I ask is for an honest review if this list helps you.
Subjects:
Grades:
PreK - 12th, Staff
Types:
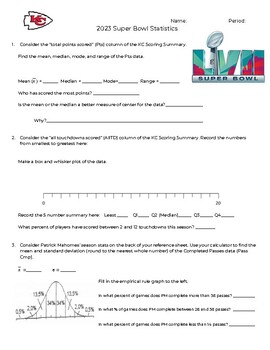
2023 Super Bowl Statistics Activity
This activity contains two stats sheets - one for the Philadelphia Eagles and one for the Kansas City Chiefs. Students are asked to use the data from the various tables to answer questions about the teams. This activity covers 1 variable statistics (mean, median, mode, range, standard deviation, box-and-whisker plot, histogram, two-way tables).This would be great as a partner activity or class activity.
Subjects:
Grades:
7th - 12th
Types:
CCSS:
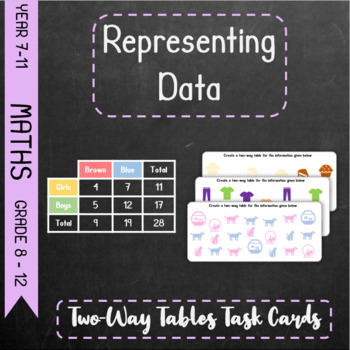
Representing Data - Two-Way Tables Task Cards
This resource consists of three different task cards, each differentiated three ways. It also includes a set of blank files to aid in creating the two-way tables.As an extension students could also draw a dual or compound bar chart.Please read the preview before purchasing to see if this lesson is appropriate for you.This lesson is based on the Pearson Key Stage 3 Maths Progress scheme of work but is appropriate the curriculum over.
Subjects:
Grades:
7th - 12th
Types:
CCSS:
Common Core Algebra I - Unit #10.Statistics
Standard statistical displays of data are reviewed at the beginning of the 10 lesson unit. Box plots are used to compare data sets and emphasize use of the quartiles and interquartile range. Measures of central tendency and dispersion, such as mean and standard deviation, are discussed and interpreted in real world scenarios. Two way frequency charts are used to compare data and bivariate data analyses allow the fitting of data with linear and exponential functions.To access the lesson videos on
Subjects:
Grades:
8th - 10th
CCSS:

Samples and Populations
This lesson will allow students to understand the concept of Samples and Populations. It has the content and videos which will provide students an engaging lesson. It also has links to an online survey that you as the teacher can conduct and control (This will need to be adapted to suit your specific class). Also included is question examples and activities for the students to engage with. The lesson goes through the following topics: samples, populations, surveys, census questionnaires and coll
Subjects:
Grades:
7th - 9th
CCSS:
10 Free Big Brain Math Problems
This is a sample of the 100 and 180 Big Brain Math Problem I have created with a couple of my students. I write these problems on the window of my classroom everyday and get about 5-10 students a day coming to try to solve them. It's been an enjoyable experience to have students come try the problem of the day and share their solutions with me. Please consider purchasing the 100 or 180 Big Brain Math Problems. There's enough for one a day for the entire school year and range from 1-5 Star diffic
Subjects:
Grades:
9th - 12th
Types:
CCSS:
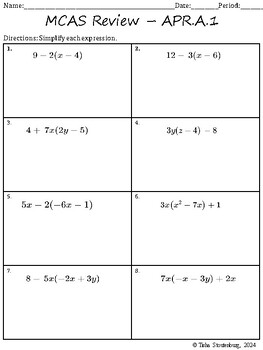
MCAS Algebra Skill Sheets
After analyzing the data for the past four years of MCAS tests, 12 standards appear on either 3 of the 4 or 4 out of the 4 exams.I pulled practice problems from various sources and created a few on my own to provide skill practice for students. The answer Key is listed separately!
Grades:
9th - 10th
Types:
CCSS:
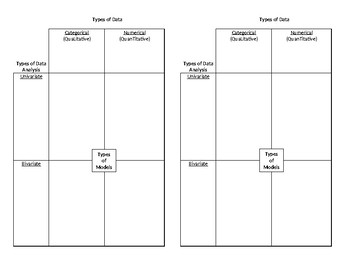
Intro to Data Analysis Graphic Organizer
I created this template for an introduction to my data analysis unit in Algebra I. We discuss and define categorical vs. numerical data, univariate vs. bivariate analysis, and the different graphs or models that apply to each. Since we use Interactive Notebooks, it is designed to be half a page.
Subjects:
Grades:
7th - 12th
CCSS:
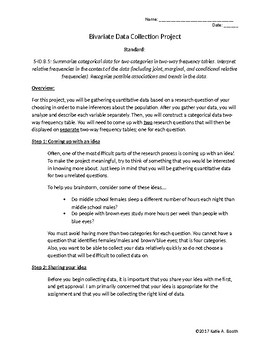
Bivariate Categorical Data Project
This is an Algebra 1 Statistics project I have completed with my students. The final project contained a hand drawn two-way frequency table with the write up and other documents attached to poster paper.
Subjects:
Grades:
8th - 12th
CCSS:
Algebra 1 - Cumulative Review
A set of 28 problems over a variety of topics including solving inequalities, average rate of change, interpreting statements written in function notation, transformations of functions and much more. An answer key aligned to CCSS and TEKS is included.Would be a good study guide for a unit test over similar topics or a practice set in preparation for an end of course or final exam.
Subjects:
Grades:
8th - 10th
Types:
CCSS:
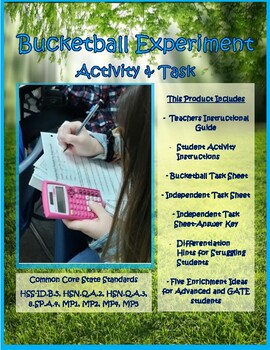
Bucketball Experiment Activity & Task
The Bucketball Experiment Activity & Task gives students an opportunity to practice gathering random data, organizing that data into a table, and then determining the relative frequency of the data in a context that is fun and personal. This activity/task has two parts. First students participate in the Bucketball Experiment Activity and record their raw data. Once that is completed and shared between teams, students will partner up to complete the second part, Bucketball Experiment Task. Th
Subjects:
Grades:
8th - 10th
Types:
CCSS:
Organizing and Visualizing Data: Population, Sample, Frequency, Graphs and Plots
z
Subjects:
Grades:
8th - 12th
CCSS:
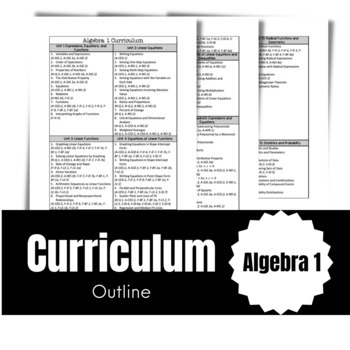
Algebra 1 Curriculum Outline
This product is associated with the content that goes with the Algebra 1 Curriculum. This also includes the Common Core Standards that go with each section in each unit. Unit notes, worksheets, reviews, and tests will be posted in the next few weeks. I will also link them here.
Subjects:
Grades:
9th - 10th
CCSS:
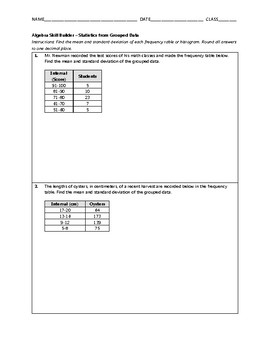
Algebra Skill Builder - Statistics from Grouped Data FREE
This 4-question skill builder helps students practice the skill of calculating mean and standard deviation of grouped data in tables and histograms. This skill builder can be used as homework, lesson consolidation, remediation, or state exam review.
+++++++++++++++++++++++++++++++++++++++++++++++
In order to provide the highest quality materials for the best teachers, please leave detailed feedback if you find an error. Also, leave your email address and I will send you a free product of your
Subjects:
Grades:
9th - 12th
Types:
CCSS:
Passion-Driven Statistics E-book (Introductory/AP Statistics Course Textbook)
Passion-Driven Statistics is an NSF-funded, multidisciplinary, project-based curriculum that supports students in conducting data-driven research, asking original questions, and communicating methods and results using the language of statistics. The curriculum supports students to work with existing data covering psychology, health, earth science, government, business, education, biology, ecology and more. From existing data, students are able to pose questions of personal interest and then use
Subjects:
Grades:
6th - 12th, Higher Education, Adult Education
Types:

Math Exit Slip for Grades 7-10
Just want to share this gorgeous ONLINE math exit slip that's built like a Kahoot! It's super easy to use and comes with auto-generated math questions for Grades 7-10 that are based off Singapore maths curriculum... My students love it :-) Best part is you don't even need to create an account to use it. Absolutely free.https://mentor.joni.ai/slipI have also included a PDF that introduces some of the other features if you sign-up for a Mentor account.
Subjects:
Grades:
7th - 10th
Types:

Financial Algebra Chapter 1 Study Guide
This is a study guide based on lessons 1-1, 1-2, and 1-5 of the text book Financial Algebra by Gerver and Sgroi. The topics covered are discretionary expenses with statistics applications.
Grades:
9th - 12th
Types:
CCSS:

Relative Frequency Tables - Unit 3 Lesson 2 (IM)
Designed for the Unit 3 Lesson 3 Relative Frequency Tables lesson from IM for the Algebra I curriculum.Students will be able to determine the percentage of those with specific prerequisites to fill out a relative frequency table as well as make determinations based on their results
Subjects:
Grades:
7th - 9th
Types:
CCSS:
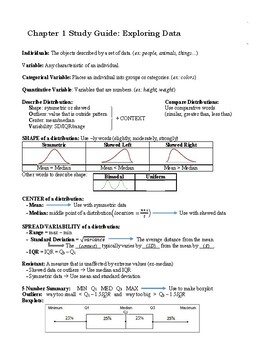
The Practice of Statistics - Chapter 1 Review Sheet
Great resource to give students after completing Chapter 1 from the Practice of Statistics textbook.
Subjects:
Grades:
9th - 12th
Types:
CCSS:
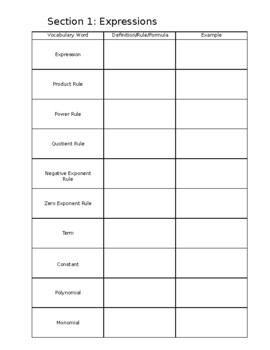
Algebra 1 EOC Vocabulary
Algebra 1 Vocabulary from each section. Completely edited. Answer key will be provided by 5/1.
Subjects:
Grades:
8th - 12th
Types:
CCSS:

Dr. Wimpey's Quick Reference for Statistics
I created this all-in-one document/foldable to help my statistics classes. It contains definitions, procedures, etc. It is useful for AP, honors, and CP levels in high school as well as college introductory statistics courses.
Subjects:
Grades:
11th - 12th, Higher Education
CCSS:
Ohio Learning Standards (OLS) for Stats + 'I Can' Statements
Are you required to use the content standards on your lesson plans? And the 'I Can' statements? This product lists the 8 Mathematical Practices, an overview of the Statistics Learning Standards, and then the standards, each one accompanied by an 'I can' statement. The OLS are almost exactly the same as the Common Core State Standards, but for a little bit of the language and the notation. Oh, and this is FREE!
Grades:
10th - 12th
CCSS:
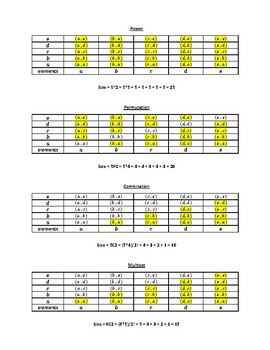
Sample Space Visualization
Visualization of the different sample spaces that can result from a two- and three-action trials on a five-item selection set if order is or is not respected, and the selections are made with or without replacement.
Subjects:
Grades:
11th - 12th, Higher Education
Types:
CCSS:
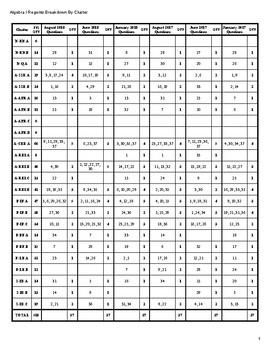
Algebra I Regents Breakdown By Cluster
Plan smarter! This document breaks down the Algebra I regents by cluster. Know which cluster is tested most on the Algebra I regents and plan accordingly. No more guessing which standards you should spend more time on.
Subjects:
Grades:
9th
Types:
CCSS:
Showing 1-24 of 29 results

