36 results
Free Common Core HSS-ID.A.4 resources
FREE EDUCATIONAL WEBSITES LIST 4 ALL GRADES K-12 AND SUBJECTS + TEACHER RESOURCE
Sometimes, you just need a list of websites for everyone. Here it is. FREE EDUCATIONAL WEBSITES Put together by Teach Me, Maria!It takes time to gather this information, figure out the appropriate grade levels, and format, maintain, and update this page. All I ask is for an honest review if this list helps you.
Subjects:
Grades:
PreK - 12th, Staff
Types:
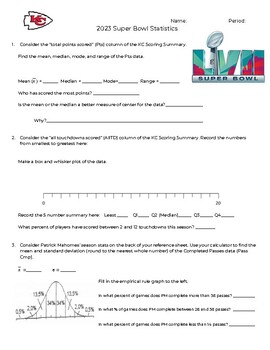
2023 Super Bowl Statistics Activity
This activity contains two stats sheets - one for the Philadelphia Eagles and one for the Kansas City Chiefs. Students are asked to use the data from the various tables to answer questions about the teams. This activity covers 1 variable statistics (mean, median, mode, range, standard deviation, box-and-whisker plot, histogram, two-way tables).This would be great as a partner activity or class activity.
Subjects:
Grades:
7th - 12th
Types:
CCSS:
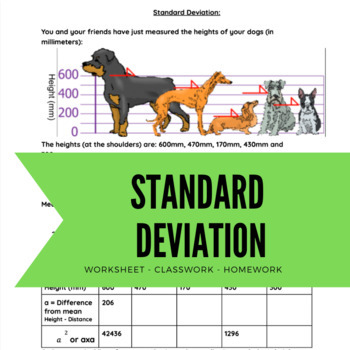
Standard Deviation, Variance, and mean practice worksheet and guided notes
Guided worksheet brings students through the steps of finding the mean, variance, and standard deviation for 5 data points. Includes three questions to check for understanding of what standard deviation is in context of a real world problem.
Subjects:
Grades:
8th - 9th
Types:
CCSS:
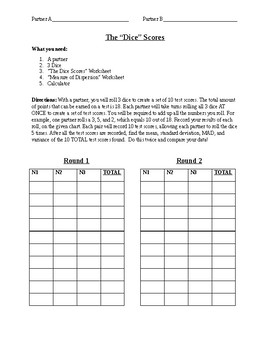
Dice Activity for Standard Deviation
This is a great activity that helps the students understand standard deviation! With a partner, the students will roll 3 dice to create a set of 10 test scores. The total amount of points that can be earned on a test is 18. Each partner will take turns rolling all 3 dice AT ONCE to create a set of test scores. They must add up all the numbers they roll. For example, one partner rolls a 3, 5, and 2, which equals 10 out of 18. Record your results of each roll, on the given chart. Each pair will r
Subjects:
Grades:
7th - 12th
Types:
CCSS:
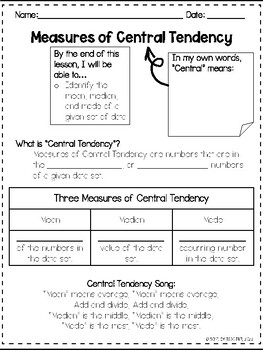
Statistics: Measures of Central Tendency Notes & Practice
Students will be learning how to solve for the mean, median, mode and range of a given data set through guided notes. There is a practice at the end for them to work on independently.
Subjects:
Grades:
6th - 9th
Types:
CCSS:
10 Free Big Brain Math Problems
This is a sample of the 100 and 180 Big Brain Math Problem I have created with a couple of my students. I write these problems on the window of my classroom everyday and get about 5-10 students a day coming to try to solve them. It's been an enjoyable experience to have students come try the problem of the day and share their solutions with me. Please consider purchasing the 100 or 180 Big Brain Math Problems. There's enough for one a day for the entire school year and range from 1-5 Star diffic
Subjects:
Grades:
9th - 12th
Types:
CCSS:
Central Tendency Notes - Mean, Median, Mode, Range, and Outlier
These notes on central tendency (mean, median, mode, range, and outlier) are a great way to introduce the analysis of number sets! I have included examples for you to teach, or you can simply print out these notes for your students to have.
Subjects:
Grades:
6th - 9th
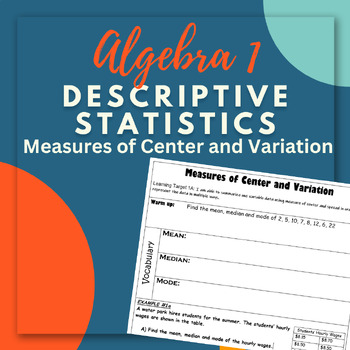
Measure of Center and Variation Notes Outline
This is an editable copy of a notes outline for Algebra 1. This outline is designed to be used within the Descriptive Statistics Unit. These notes cover measure of center and variation. Check out my other notes outlines and my student reflection tools that align with the notes for each unit!
Grades:
9th - 12th
CCSS:
Also included in: Descriptive Statistics Notes and Student Reflection Bundle
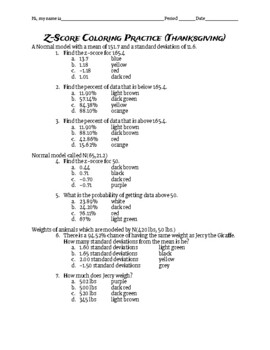
Z-Score Coloring Activity (Thanksgiving)
Great Extra practice calculating and applying z-score to a normal distribution problem. Print this out as a packet or use your desired technology to let students draw on the pdf!
Subjects:
Grades:
10th - 12th
Types:
CCSS:
Common Core Algebra II - Unit #13 Statistics
We start this 13 lesson unit with review of major descriptive statistics. The normal distribution and normally distributed populations are explored and probabilities are explored using graphs, tables, and the calculator. Inferential statistics are then explored using statistical simulation. Sample means, proportions, and treatments are all developed by use of simulation. Finally, regression and correlation are reviewed and extended, including sinusoidal regression.To access the lesson videos on
Subjects:
Grades:
10th - 11th
CCSS:
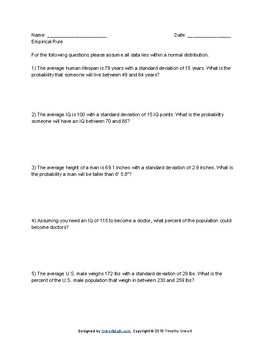
FREE Worksheet (for a limited time) on the Empirical Rule - HSS.ID.A.4
In this free (for a limited time) worksheet students answer 10 questions about normally distributed data using the Empirical Rule to look at the probability of being in between standard deviations on the normal curve. Answer key included. 4 pages total.
Subjects:
Grades:
10th - 12th
Types:
CCSS:

Oh So Sweet Statistics - A Histogram Project
Give students the unique opportunity to not only create their own statistics, but reflect on their own progress too! We started with an estimation station each week, where I filled a new size jar with a different candy across three weeks. The student who had the lowest absolute deviation from the actual amount of candy in the jar - WON THE WHOLE JAR! After three weeks, we had more than enough candy and data to peak their interest. Students now get to use the results to engage with one variable s
Subjects:
Grades:
8th - 10th
Types:
CCSS:
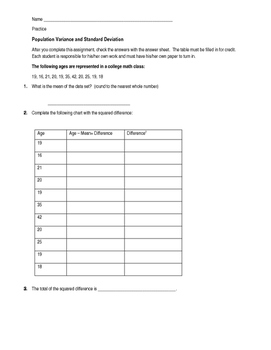
Find the Standard Deviation with Population Variance
Using a set of data, determine the mean, population variance, and standard deviation. Students will then plot the information on a normal distribution curve.
This worksheet uses the following variance formula: the sum of the squared differences divided by the number of terms.
This is a word file so you can alter to suit the needs of your class.
Subjects:
Grades:
9th - 12th, Higher Education
Types:
CCSS:
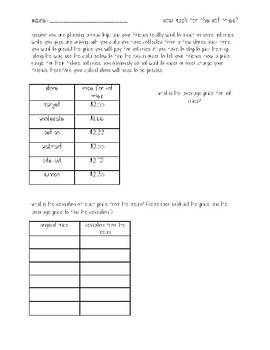
Mean Absolute Deviation Activity
This activity is aligned with the TransMath Unit 1 Lesson for Mean Absolute Deviation (MAD). Students should have prior exposure to MAD before completing the activity. Students' mission is to analyze the data given for various prices of Hot Fries. Students will need to analyze and interpret the data by finding the mean, as well as, MAD in order to inform their friends on a range they can expect to pay for the Hot Fries along their road trip.
Subjects:
Grades:
8th - 11th
Types:
CCSS:
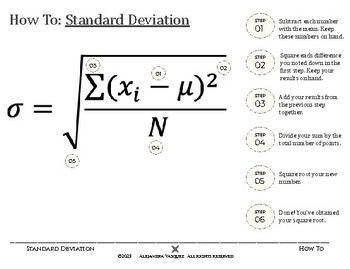
Standard Deviation Visual
Making math less intimidating, this visual lists the steps for standard deviation. The numbers correspond to the symbols on the formula. Free download!
Subjects:
Grades:
9th - 12th, Higher Education
CCSS:
Jeopardy Game for Statistics and Probability Topics
Run out of time to create an engaging activity for your Subject Matter : Statistics and Probability? Don't worry I got you. I offer you this jeopardy game slideshow that will surely engage your students to learn this topic.In this game, there is a board containing boxes with different amounts/scores.To play this game, you can do the following:1st:Group the students2nd: Tell the students that each boxes corresponds to different questions, if they are able to give the correct answer in a particula
Subjects:
Grades:
11th
Types:
CCSS:
SID.4 Calculating the Area Under the Normal Curve.
This lesson teaches students how to use the mean and standard deviation of a data set to create a normal curve and how to calulate the area (population percentage) under the normal curve given a range of values.
This lesson includes a SMART Notebook Presentation, guided notes with class work problems, and an answer key. The guided notes correspond with the SMART Notebook Presentation.
Subjects:
Grades:
9th - 12th
CCSS:

Statistics Vocabulary
Common Statistics Vocabulary for High School Math unit
Subjects:
Grades:
7th - 12th
Types:
CCSS:
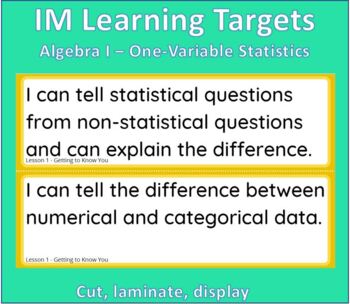
IM Learning Targets Algebra I Unit 1 - One-Variable Statistics
Print, cut, laminate and then adhere to your objectives board in your classroom! Put magnets on the back for easy reuse.Each Learning target includes the lesson in IM that it corresponds to.Prints on legal paperCheck out the learning targets for other units6th Grade6.1 Area and Surface Area - FREE6.2 Introducing Ratios7th Grade7.1 Scale Drawings - FREE7.2 Introducing Proportional Relationships7.3 Measuring Circles7.4 Proportional Relationships and Percentages7.5 Rational Number Arithmetic7.6 Exp
Subjects:
Grades:
8th - 9th
CCSS:
Also included in: IM Learning Targets Algebra I Bundle

Starting a Biology Lab #AtHome + Bonus Measurement Lab
You need a lab #athome to do lab work #athome. Here you get the basics for setting up a home lab using readily available stuff. From materials to spaces to safety, chemicals, organisms, and measurements, Labs4Home activities will ask you to look at your household supplies differently. Bonus Measurement Lab: Try a Labs4Home lab for free! An entire full lesson plan was added to show you how Labs4Home lessons are put together. The Liquid Measurement Lab covers SI Units, accuracy, precision, an
Subjects:
Grades:
6th - 12th, Higher Education, Adult Education
CCSS:
NGSS:
MS-ETS1-2
, MS-ETS1-4
, MS-ETS1-1
, MS-ETS1-3
Also included in: Labs4Home Biology Labs Bundle
Passion-Driven Statistics E-book (Introductory/AP Statistics Course Textbook)
Passion-Driven Statistics is an NSF-funded, multidisciplinary, project-based curriculum that supports students in conducting data-driven research, asking original questions, and communicating methods and results using the language of statistics. The curriculum supports students to work with existing data covering psychology, health, earth science, government, business, education, biology, ecology and more. From existing data, students are able to pose questions of personal interest and then use
Subjects:
Grades:
6th - 12th, Higher Education, Adult Education
Types:
Math Exit Slip for Grades 7-10
Just want to share this gorgeous ONLINE math exit slip that's built like a Kahoot! It's super easy to use and comes with auto-generated math questions for Grades 7-10 that are based off Singapore maths curriculum... My students love it :-) Best part is you don't even need to create an account to use it. Absolutely free.https://mentor.joni.ai/slipI have also included a PDF that introduces some of the other features if you sign-up for a Mentor account.
Subjects:
Grades:
7th - 10th
Types:
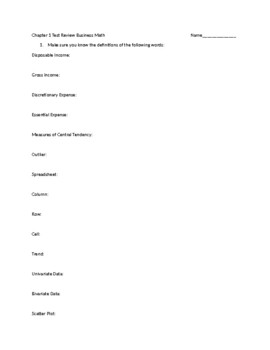
Financial Algebra Chapter 1 Study Guide
This is a study guide based on lessons 1-1, 1-2, and 1-5 of the text book Financial Algebra by Gerver and Sgroi. The topics covered are discretionary expenses with statistics applications.
Grades:
9th - 12th
Types:
CCSS:
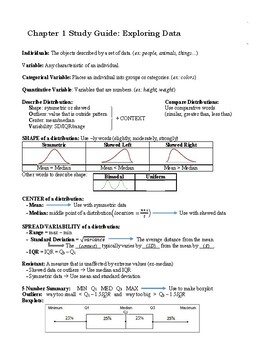
The Practice of Statistics - Chapter 1 Review Sheet
Great resource to give students after completing Chapter 1 from the Practice of Statistics textbook.
Subjects:
Grades:
9th - 12th
Types:
CCSS:
Showing 1-24 of 36 results

