Alejandra Vasquez
2 Followers
Grade Levels
9th - 12th, Higher Education
Subjects
Resource Type
Standards
CCSSHSS-ID.A.2
CCSSHSS-ID.A.4
Formats Included
- PDF
Pages
1 page
Alejandra Vasquez
2 Followers
Description
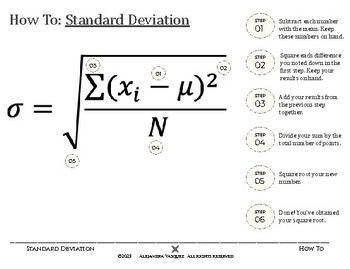
Making math less intimidating, this visual lists the steps for standard deviation. The numbers correspond to the symbols on the formula.
Free download!
Total Pages
1 page
Answer Key
N/A
Teaching Duration
40 minutes
Report this resource to TPT
Reported resources will be reviewed by our team. Report this resource to let us know if this resource violates TPT’s content guidelines.
Standards
to see state-specific standards (only available in the US).
CCSSHSS-ID.A.2
Use statistics appropriate to the shape of the data distribution to compare center (median, mean) and spread (interquartile range, standard deviation) of two or more different data sets.
CCSSHSS-ID.A.4
Use the mean and standard deviation of a data set to fit it to a normal distribution and to estimate population percentages. Recognize that there are data sets for which such a procedure is not appropriate. Use calculators, spreadsheets, and tables to estimate areas under the normal curve.


