29 results
Adult education Common Core HSS-ID.A.4 resources
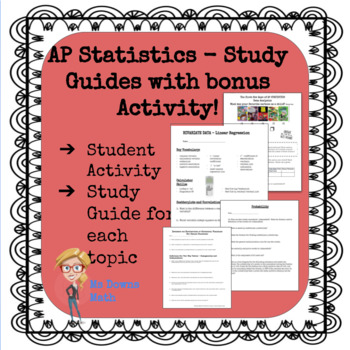
AP Statistics Study Guides - All Topics!
There is a pdf file study guide for each topic in the AP Statistics curriculum. Exploring Data, Normal Distributions, Linear Regressions, Experiments and Designing Studies, Probability, Random Variables, Sampling Distributions, Confidence Intervals, Hypothesis Tests, Comparing Populations, Chi Square Procedures, and Inference about Regression. I have students complete one for each unit. At the end of the year, they have a great study packet for the AP Exam! Student feedback has indicated that th
Subjects:
Grades:
9th - 12th, Higher Education, Adult Education
Types:
CCSS:
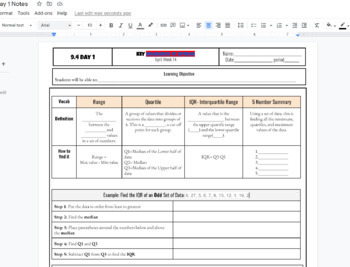
IQR interquartile Range and 5 number summary box and whisker plot Notes
IQR interquartile Range and 5 number summary box and whisker plot Notes including Q1, Q2, Q3, Min and Max and step by step both examples of finding the IQR and creating a box and whisker plot. Used in HS math 1 class WITH KEY INCLUDED AS a link to a printable PDF
Subjects:
Grades:
7th - 12th, Higher Education, Adult Education
CCSS:
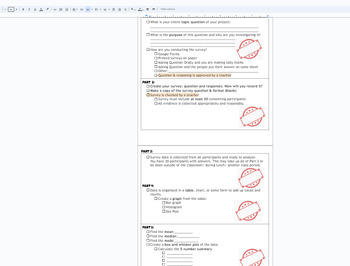
Statistics Survey project Discovery (broken down into sections) with Rubric
This is a broken down (scaffolded) packet of instructions/ guide for a Stats Project for Math 1 HS or 8th grade students. The goal of the project is for students to take a statistical survey on quantitative data (numbers) of their choice. Using this data from the survey, the following will be included in the project:Survey- the question being askedSurvey responses (requirement of 30)Data organization: Bar chart, Histogram, Dot PlotMeanMedianModeBox and Whisket Plot5 number summary (Q1,Q2,Q3, min
Subjects:
Grades:
7th - 12th, Higher Education, Adult Education
CCSS:

Normal Distribution Foldable Popup
This is a popup of a normal distribution graph, showing students the probable spread of data within 1, 2, 3, and 4 standard deviations of the mean. The formulas for the population standard deviation and the sample standard deviation are both included. It is a great reference/graphic organizer for student notebooks and I have even had students who weren't in my class ask to join because they wanted this popup too. Useful for math or maths class, great for visual and kinesthetic learners, and
Subjects:
Grades:
9th - 12th, Higher Education, Adult Education
CCSS:
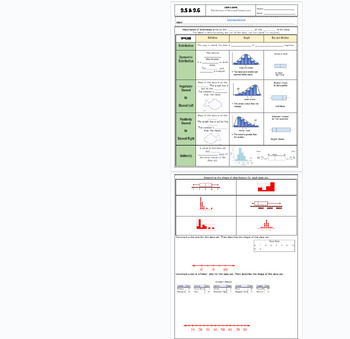
Data Distribution positive/negative skewed fillable notes UPDATED
Unit 9: Data and Stats: Updated(No 9.3/ Skip)9.5/9.6 Data Distribution (skewness)Students go over the vocabulary and complete the examples with the vocabulary scaffolded. Skewness is explained and how to identify it comparing data charts and box and whisker plots. Uses many visuals and examples to differentiate between that different graphs. Notes are scaffolded. Includes hook video hyperlinked on the "learning objective" title. Key is included and hyperlinked as a PDF in the heading highlighted
Subjects:
Grades:
6th - 12th, Higher Education, Adult Education
CCSS:
Also included in: Unit 9: Data and Statistics Fillable Notes

Unit 9: Data and Statistics Fillable Notes
Unit 9: Data and Stats(No 9.3/ Skip)9.1 Central Tendencies: Mean, Median and Mode9.2 Graphical Data: Bar Charts, Dot Plots and Histograms9.3 NONE9.4A 5 number summary and box and whisker plots 9.4B Standard Deviation9.5/9.6 Data Distributions (skewness) left or right9.7 Frequency Tables and relative frequency tablesStudents go over the vocabulary and complete the examples with the vocabulary scaffolded. Notes are scaffolded. Includes hook video hyperlinked on the "learning objective" title. Key
Subjects:
Grades:
6th - 12th, Higher Education, Adult Education
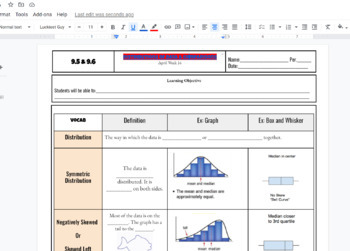
Distributions of Data Scaffolded Fillable Notes (Skewed Left & right) w/ KEY
Distributions of Data Scaffolded Fillable Notes (Skewed Left & right) Includes a problem of creating box plot, bar chart, and dot plot. KEY IS INCLUDED linked at top of title highlighted in red!!! , Algebra 1 or Math 1 class in highschool setting IEP 504 EL learners visuals for better understanding. YOU CAN EDIT THE GOOGLE DOC to your liking!!!
Subjects:
Grades:
7th - 12th, Higher Education, Adult Education
CCSS:
Standard Deviation Fillable Notes UPDATED
Unit 9: Data and Stats: Updated(No 9.3/ Skip)9.4 B Standard DeviationStudents go over the vocabulary and complete the examples with the vocabulary scaffolded. Standard deviation is long hand calculated by showing each step of the process (difference of squares). Real-world examples are explained in notes before calculating to show the importance of this stat and why it is used so often to verify valuable and effective data. Notes are scaffolded. Includes hook video hyperlinked on the "learning o
Subjects:
Grades:
7th - 12th, Higher Education, Adult Education
CCSS:
Also included in: Unit 9: Data and Statistics Fillable Notes
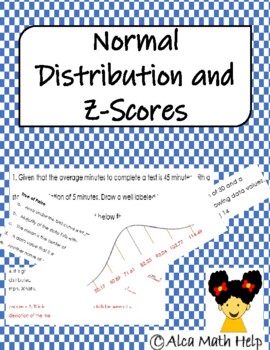
Normal Distibution and Z-Score- Statistics and AP Statistics
At the end of this activity students will be able to:•Calculate z-score and actual score/data value•Calculate standard deviation•Explain what is meant by unusual and or usual z-score•Create normal distribution curve (bell curve)•Use the 68-95-99.7 % rule to tell the regions of specific z-score •Answer sheet included!! This activity sheet can be used as a classwork, homework, pop quiz end of Unit Quiz.Marks should be personalized by teacher/users; also, students should be advised if they should s
Subjects:
Grades:
11th - 12th, Higher Education, Adult Education, Staff
Types:
CCSS:
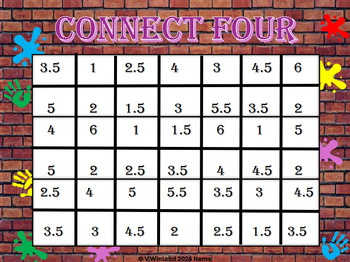
Connect Four ( Statistics)
Statistics Connect FourConnect four by rolling dice and finding averages.Students have to keep track of frequency and relative frequency.Also create a histogram and decide if frequencies create a uniform, normal curve or skewed curve.
Subjects:
Grades:
10th - 12th, Higher Education, Adult Education
Types:
CCSS:
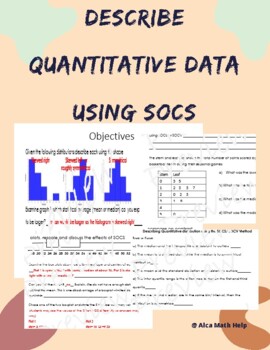
Describe Quantitative Data using SOCS/SOCV- Box plot, Histogram, Stem plot
If you are looking for a worksheet that can be used as a quiz, test, review packet you are at the right place. This activity sheet is suitable for students doing AP Stats and CP Probability and Statistics. This activity sheet allows students to:Use prior knowledge to answer true false questions and fill in the blanks with vocabulary provided.Describe box plots, histogram and stem plot using SOCS.Interpret the shape, center, outlier or any unusual feature along with the spread.
Subjects:
Grades:
11th - 12th, Higher Education, Adult Education, Staff
CCSS:
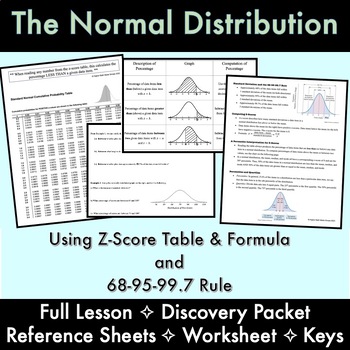
NORMAL DISTRIBUTION: Lesson, Class Packet, Homework, Reference Sheets, & KEYS
Students see first-hand in the Normal Distribution DISCOVERY scaffolded packet how the mean equates to z-score= 0, and they can use the shortcut method to determine integer z-values [adding/subtracting the standard deviation]. Students learn how to sketch a bell curve based on the give mean and standard deviation, and interpret the percentages using the z-score formula, chart and 68-95-99.7 Rule.Teaching this for many years I have finally perfected the SCAFFOLDED FLOW of introducing Normal Distr
Subjects:
Grades:
9th - 12th, Higher Education, Adult Education
CCSS:
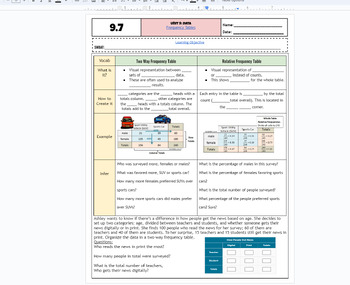
Frequency Tables & Relative Frequency Tables fillable notes UPDATED
Unit 9: Data and Stats: Updated(No 9.3/ Skip)9.7 Frequency Tables Students go over the vocabulary and complete the examples with the vocabulary scaffolded. Students examine a categorical table/frequency table and also use that information to create relative frequency tables. Different real-world examples and problems are used. Emphasized how percents and decimals are calculated. Notes are scaffolded. Includes hook video hyperlinked on the "learning objective" title. Key is included and hyperli
Subjects:
Grades:
6th - 12th, Higher Education, Adult Education
CCSS:
Also included in: Unit 9: Data and Statistics Fillable Notes
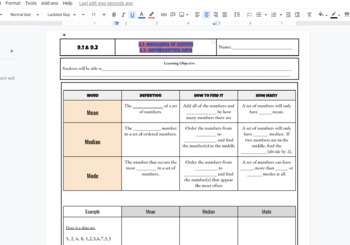
Mean, Median, Mode and Dot plot, bar graph histogram Fillable Notes Scaffolded
Central Tendencies: Mean, Median and Mode Fillable Notes Scaffolded used in math 1 classroom to introduce the data unit. Also includes dot plot, histogram and bar chart lesson. KEY IS INCLUDED!
Subjects:
Grades:
7th - 12th, Higher Education, Adult Education
CCSS:
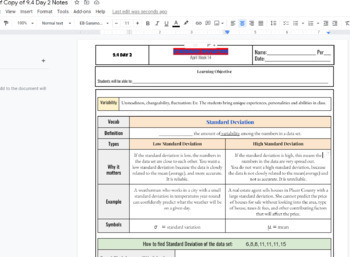
Standard Deviation Scaffolded Fillable Notes AND key
Standard Deviation Scaffolded Fillable Notes AND key, give definitions to the terms with real-world examples! Includes a video link in the notes as the intro to the lesson by describing the meaning and need for standard deviation in the simplest form possible! The key is linked at the top of notes as well that will download as a pdf- not a google doc- did not do the last problem on the bottom as it was an exit ticket for students (no layout).
Subjects:
Grades:
7th - 12th, Higher Education, Adult Education
CCSS:

Algebra 1 - Common Core Practice Final Exam - Google Form #1 (45 Questions)
Hello! The purchase of this product grants the purchase of one (1) DIGITAL (Google Forms) self-grading assessments, which is a practice final exam that has a mix of forty-five (45) multiple-choice & fill-in-the-blank questions on Algebra 1 - 1st Semester Common Core Curriculum.Goals Of This Assessment: Students will be able to:Simplify or identify equivalent algebraic expressions. Represent math relationships using symbolic algebra. Differentiate between linear and nonlinear functions. Model
Subjects:
Grades:
6th - 12th, Higher Education, Adult Education
Types:
CCSS:
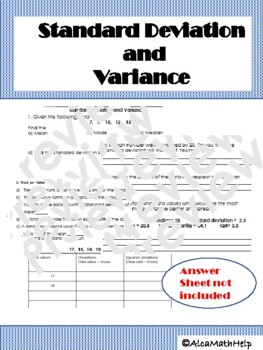
Standard Deviation and Variance AP Stats, CP probability and Statistics
If you are looking for an activity sheet that will help students to practice standard deviation and variance both by hand and the table. This is the activity you are looking for. Not too complex but requires some level of thinking.Objectives:1. Students should be able to interpret the relationship between the mean and standard deviation. 2. Students should know how the change in variables affects the spread and center. 3.Students will be able to complete a knowledge-based section by answering tr
Subjects:
Grades:
10th - 12th, Higher Education, Adult Education, Staff
CCSS:
People Perfectly in Proportion: The Golden Ratio
Zip File includes - PDF and editable documentLesson Setup: This lesson can be used for students at all developmental levels. Measuring with a ruler, error analysis, and proportional thinking are a few of the skills this lesson practices. Groups can be made based upon skill requirements. Lower functioning students can perform measurements and watch higher performing students do calculations. Result could also be presented by a possible third student - if you want to do trios as opposed to pa
Subjects:
Grades:
3rd - 12th, Adult Education
Types:
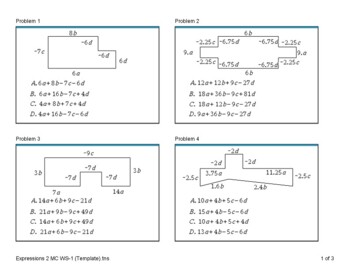
Algebra 2 Workbook (2020)
This Algebra 2 file contains 8 question or 16 question or 24 question practice problems and 16 questions chapter review tests. This was created to help out teachers looking for quality resources with answer keys.Topics:1 - Polynomial Arithmetic2 - Radicals3 - Absolute Value and Inequalities4 - Systems5 - Polynomial Graphs6 - Graph Transformations7 - Domain and Range8 - Inverse and Composite9 - Exponents and Asymptotes10 - Regression Analysis11 - Series and Sequences12 - Statistics
Subjects:
Grades:
9th - 12th, Higher Education, Adult Education
Types:
CCSS:
Also included in: Algebra 2 Bundle
Margin of Error Notes and Practice
Teach your students about Margin of Error with these scaffolded notes and practice problems. This Product Includes:NotesPractice problemsAnswer Key
Subjects:
Grades:
8th - 12th, Higher Education, Adult Education
CCSS:
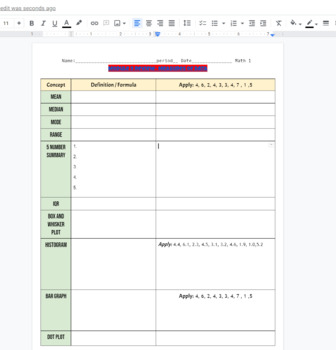
Measures of Data review sheet/ study guide, Mean, median, mode, st. deviation
I use this in my class as a review for Module 9 which is the Measures of Data review sheet/ study guide, Mean, median, mode, standard deviation, 5 number summary, skewed left, right, histogram, box plot, dot plot, bar graphs. This is used as a study guide where students can write out their formula or definition and apply it in the same column. 100 percent editable WITH KEY INCLUDED. This can be a homework assignment, cheat sheet, pre-assessment or post-assessment on a chapter in Math 1 HS course
Subjects:
Grades:
6th - 12th, Higher Education, Adult Education
Types:
CCSS:
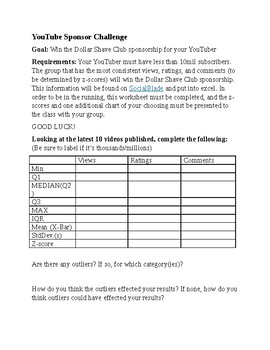
Youtube 5 Number Summary Challange
Students have to use statistical knowledge to win this challenge using their favorite youtubers statistics. Meets standards: HSS-ID.A.1HSS-ID.A.2HSS-ID.A.3HSS-ID.A.4CCRA.SL.1CCRA.SL.2CCRA.SL.4CCRA.SL.5
Subjects:
Grades:
10th - 12th, Higher Education, Adult Education
Types:
CCSS:

Starting a Biology Lab #AtHome + Bonus Measurement Lab
You need a lab #athome to do lab work #athome. Here you get the basics for setting up a home lab using readily available stuff. From materials to spaces to safety, chemicals, organisms, and measurements, Labs4Home activities will ask you to look at your household supplies differently. Bonus Measurement Lab: Try a Labs4Home lab for free! An entire full lesson plan was added to show you how Labs4Home lessons are put together. The Liquid Measurement Lab covers SI Units, accuracy, precision, an
Subjects:
Grades:
6th - 12th, Higher Education, Adult Education
CCSS:
NGSS:
MS-ETS1-2
, MS-ETS1-4
, MS-ETS1-1
, MS-ETS1-3
Also included in: Labs4Home Biology Labs Bundle
Passion-Driven Statistics E-book (Introductory/AP Statistics Course Textbook)
Passion-Driven Statistics is an NSF-funded, multidisciplinary, project-based curriculum that supports students in conducting data-driven research, asking original questions, and communicating methods and results using the language of statistics. The curriculum supports students to work with existing data covering psychology, health, earth science, government, business, education, biology, ecology and more. From existing data, students are able to pose questions of personal interest and then use
Subjects:
Grades:
6th - 12th, Higher Education, Adult Education
Types:
Showing 1-24 of 29 results

