2 results
U.S. History simulations for Microsoft Excel

Congressional Apportionment, Representation, and Gerrymandering
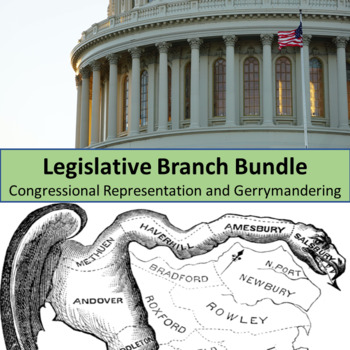
Now that the 2020 U.S. Census and apportionment have been completed, we can start to see who has the most representation in Congress and who has the best ratio of population to Congress members. These data points, along with how districts are manipulated via gerrymandering, are addressed in these products.Questions?Email me at inquiryforTDSR@gmail.comThank You For Your Purchase!If you enjoyed this product you can let other teachers know by leaving a review. You'll earn TpT Credits when you do! I
Subjects:
Grades:
7th - 12th
Types:

Election Graphs
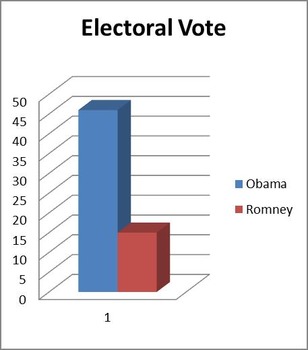
Hold elections in your classroom and use these graphs to show results of presidential and local elections. All you have to do is fill in the names of the candidates and decide how many electoral votes each class will have!
Students will be able to compare popular and electoral votes and see how many votes each candidate receives! This spreadsheet is great as a supplement to a lesson on elections.
Subjects:
Grades:
6th - 12th
Types:
Showing 1-2 of 2 results


