7 results
6th grade graphing research for Microsoft Word

Facts About Endangered Species - Bar Graph and Data Analysis
Complete independent study and activity to bring awareness to endangered species. Students get introduced to the Endangered Species Act, answer questions, create a graph based on data provided, and prepare a PowerPoint presentation on a species of their choice. This is a complete activity where students are engaged and practice their analysis and graphing skills. They take ownership of their work by selecting the subject of their research and presenting their report to the group. This is a ve
Subjects:
Grades:
5th - 8th

6 Editable Bar Graph Templates 2.0
Finally a simple and professional graph space that students can fill out without any design issues getting in the way. This file contains 6 ready-to-use graph options. Print them and have students fill them with pencil and ruler, or distribute them over computer and let them practice entering the data. Get a project perfect finish every time. Maybe you just want to fill it out live on a projector? The possibilities are endless! It's okay to say you love these bar graphs. So do we.Contains:- 2 bl
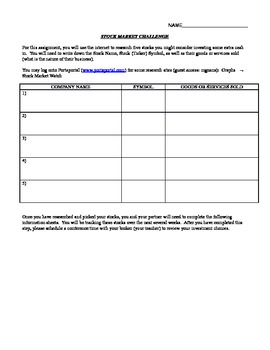
Stock Market Challenge Information Sheet
This document provides students a place to record the information they have gathered from their Stock Market research. It includes a place for students to record their stocks' 52-week high and low, dividends paid, does the company produce goods or provide services, as well as the reasoning as to why your student chose to purchase that particular stock. There are enough recording sheets for 5 stocks. This is a great way to teach students how to record and organize information for later use. If
Subjects:
Grades:
4th - 7th
Types:
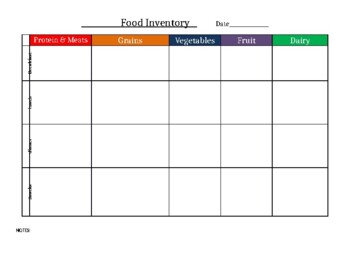
Food Inventory Daily Food and Nutrition Chart/Tracker
Food Inventory Daily Food and Nutrition Chart/TrackerSee preview for setup!
Subjects:
Grades:
PreK - 12th

Olympics
I wanted to create a fun unit for my students, but make it educational also. In this unit there are 30 countries that the students can choose from and then a research page for them to fill out about the country they chose. I then created a facebook fake page worksheet for them to fill out and allow them to follow the country they have throughout the Olympic games. I have left further instructions in the packet. I also included a tally chart for them to keep track of the medals their country
Subjects:
Grades:
3rd - 6th
Types:
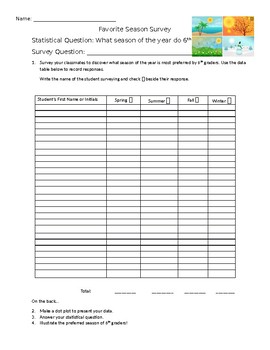
What is your favorite season? Practicing Statistics Class Survey
Students will practice the steps of statistics - gathering data, organizing data, analyzing data, interpreting and presenting data. Students will survey their classmates using the survey question, What is your favorite season? Students will practice statistical questions, data tables, dot plots and illustrations.
Subjects:
Grades:
5th - 8th
Types:
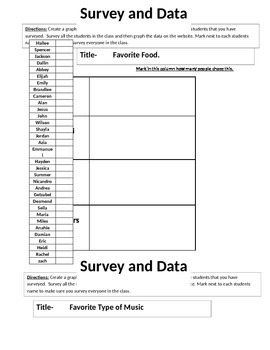
Collect Data for graphing worksheet
6 different worksheets for collecting data to create a graph. Includes a student check-off list to make sure that each student is surveyed. Fun engaging activity that will be a hit.
CLICK PREVIEW to see a detailed video about this lesson
If you like this lesson please follow us.
Subjects:
Grades:
3rd - 7th
Types:
Showing 1-7 of 7 results


