13 results
Common Core HSS-MD.A.3 projects
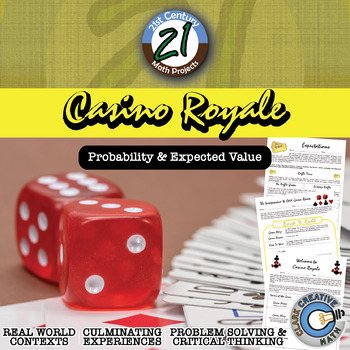
Casino Royale -- Expected Value & Probability Game - 21st Century Math Project
Your students might be begging for for a day for them to play games. Let it be on your terms in this 21st Century Math Project! This Expected Value and Probability Project focuses on one of the more emphasized aspects of the Common Core Standards. Students will be asked to design their own games with defined expected value and host it in a Game Day event! The student that collects the most "Swagg Cash" will forever (or at least for 36 hours) be known as the Master of Swagg. ***THIS PRODUCT HAS B
Subjects:
Grades:
6th - 12th
Types:
CCSS:
Also included in: Probability & Expected Value Unit Bundle - Distance Learning Compatible
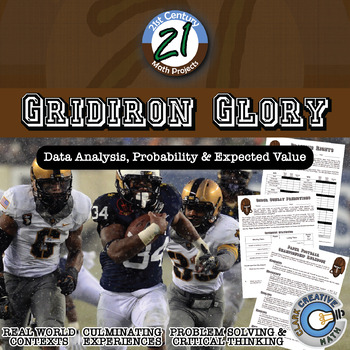
Gridiron Glory -- "Big Game" Data & Paper Football - 21st Century Math Project
I have heard that Americans like Football. I have also heard about an important game that happens in February. I have heard that it's a day that nachos dread. In this 21st Century Math Project, students will complete a variety Football-based assignments related to the Statistics strands of the Common Core. The project caps off with a Paper Football tournament that asks students to use expected value to guide their decisions!This product includes 3 prep assignments that reaches a variety of learn
Subjects:
Grades:
6th - 12th
Types:
CCSS:
Also included in: Probability & Expected Value Unit Bundle - Distance Learning Compatible
AP Statistics
This AP Statistics curriculum bundle contains the following (please take time to preview video and/or individual item previews):Guided Notes and Graphic Organizers (EDITABLE)Exhibition stations (slides) with guided notes (EDITABLE)ActivitiesProjects (EDITABLE)Exams (EDITABLE)Teacher's pacing guide and suggested order for each unit Review in AP style for preparation for the APCOMING: powerpoint with guided notes for each of 9 units NEW! UNIT 1 and UNIT 2 slides and editable notes are currently in
Subjects:
Grades:
10th - 12th
CCSS:
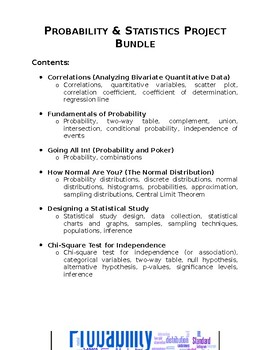
Probability & Statistics Project Bundle
A bundle that contains six different projects for a Probability & Statistics high school course. This bundle includes: Correlations (Analyzing Bivariate Quantitative Data) Fundamentals of Probability Going All In! (Probability, Combinations, and Poker) How Normal Are You? (The Normal Distribution) Designing a Statistical Study Chi-Square Test for Independence These projects are designed to engage students in authentic, hands-on, performance-based tasks. For each of these projects, students c
Subjects:
Grades:
9th - 12th
Types:
CCSS:
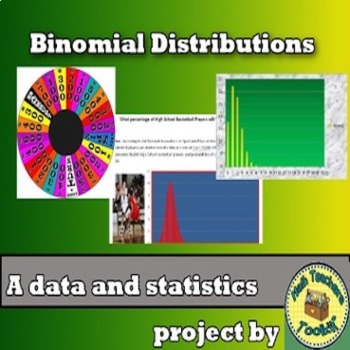
Binomial Distribution Project (Data and Statistics)
Students will create 2 reports for this project:The first is a situation where the probability can be calculated. Examples include:*What are the chances of guessing on a 4 question multiple choice test (with possible answers a, b ,c, and d) and getting 0 right?*If I pressed 20 piano keys what are the chances of 3 C#’s?The second is a situation where the probability is defined empirically and the student must lookup the value. Examples include: *What percentage of flights end in a plane crash? *W
Subjects:
Grades:
10th - 11th
Types:
CCSS:
Also included in: All my Algebra2/Precalc Resources
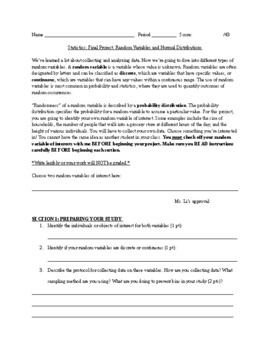
Statistics Project: Normal Distributions and Random Variables for High School
Hello! This is my most popular project, with statistics teachers AND students. Are you looking for a final project or a project-based assessment for normal distributions and random variables? This resource is perfect for high school statistics teachers who are looking to bring some real-world applications to normal distributions. Students will be collecting their own samples and analyzing data. They will be making bell curves, labeling parts of the normal distribution, and answering specific que
Subjects:
Grades:
10th - 12th, Higher Education
Types:
CCSS:
Also included in: Normal Distributions and Random Variables Bundle: High School Statistics
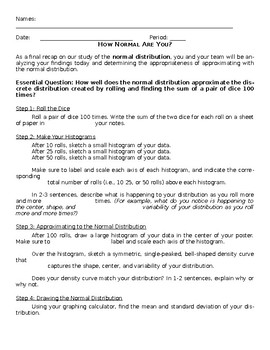
Project: How Normal Are You? (The Normal Distribution)
Project guidelines and rubric for a project on probability distributions, more specifically discrete and normal distributions. Students create histograms to display their data (the sum of two dice) at various stages (10, 25, 50, and 100 rolls), approximate the normal curve to their discrete distribution, draw a normal curve, calculate probabilities for both the discrete and normal distributions, and assess their approximation. This project also teases the concepts of sampling distributions and
Subjects:
Grades:
9th - 12th
Types:
CCSS:

Teaching with Baseball Statistics
I use this activity to teach my science students how to model an idea using data. Students learn to predict the outcomes of a baseball pitcher based on their last 3 years of stats. Students learn to analyze their data and determine trends in the data. Students also learn to compare data from their pitcher to other students' pitchers (collaboration). Students also must be able to/learn to accurately graph their data. There is also a research component as students must research their pitcher's
Expected Value Statistics Carnival Project
Easy project for students to really understand expected value. This packet takes students (usually a group of 2-3) through the process of building their own carnival game. Then, I choose a day for the class to set up their games and each student is given a certain amount of stats dollars. Each group records how many time their game gets played and what the outcome was for the player. During the next class, we see how class the real-life outcome compares to the expected value. Also a good way to
Subjects:
Grades:
10th - 12th
Types:
CCSS:
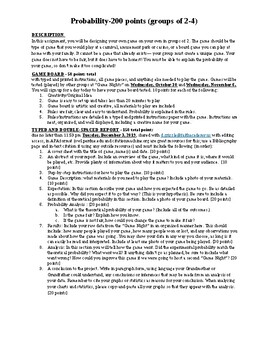
Bluman Statistics Chapter 4 Project
This is a Microsoft Word document, so it can be edited to fit your own classroom needs. It is a project I used in my 12th grade Statistics class. I gave it out the second week of second quarter and set aside one day a week to work with my students on this project through all of first quarter. I also hosted "Game Nights" in which we played and collected data from the games that were created for this project.This project is aligned with chapter 4 of Elementary Statistics: A Step by Step Approach 8
Subjects:
Grades:
11th - 12th, Higher Education
Types:
CCSS:
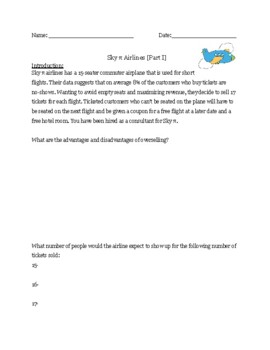
Binomial Distribution Airline Simulation Project
A project simulating an airline deciding how many tickets to sell for a 15 passenger plane if the no-show rate is 8%.
Subjects:
Grades:
10th - 12th
Types:
CCSS:
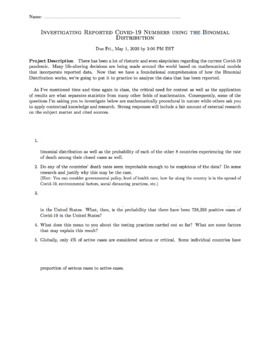
Binomial Distribution Project: Investigating COVID-19 Data
Use the binomial random variable to investigate questions regarding current Covid-19 data."There has been a lot of rhetoric and even skepticism regarding the current Covid-19 pandemic. Many life-altering decisions are being made around the world based on mathematical models that incorporate reported data. Now that we have a foundational comprehension of how the Binomial Distribution works, we’re going to put it to practice to analyze the data that has been reported."(Customizations and answer ke
Subjects:
Grades:
9th - 12th
Types:
CCSS:
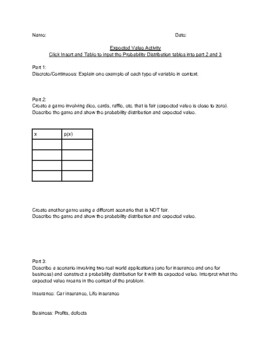
Expected Value Activity
In this activity, students will calculate and describe real world examples of probability distributions and expected values.
Subjects:
Grades:
11th - 12th, Higher Education
Types:
CCSS:
Showing 1-13 of 13 results

