7 results
6th grade Common Core 7.EE.B.4a laboratories
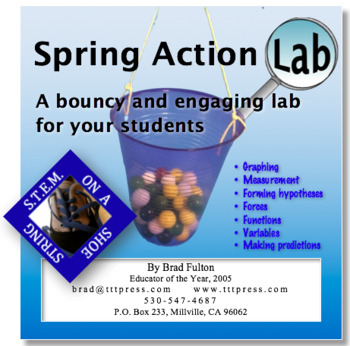
Spring Action Lab: A Bouncy and Engaging STEM Lab
Students will enjoy putting their learning to work in this engaging lab. Using springs or rubber bands, students measure and record data as they try to get a bucket to touch the floor by adding weights. Then they use their data and its graph to make predictions and write equations that will help them predict the outcomes. This simple and inexpensive lab will help your students learn graphing, t-tables, measurement, linear functions, and the physics of tension forces. This can be used as a stand-
Subjects:
Grades:
5th - 9th
Types:
Investigating density to find the main metal in U.S. pennies? MS PS1-2 CER SEP
Investigating density to find the main metal in U.S. pennies. MS PS1-2 CER SEPThese engaging activities (GOOGLE and PDF versions) allow students to gain a greater understanding of what density is and how it can be used to identify materials.A review (or introduction) of mass, volume, and density is given including a short activity where students “discover” the formula for density. This is followed by three stations where the skills and knowledge needed for the main investigation are practiced or
Subjects:
Grades:
6th - 9th
NGSS:
MS-PS1-2
How Much for Those Fries? The Math in Action Series.
Ever wonder how the price at a "Fast Food" restaurant may be determined. This activity may just answer that question for you. The application of mathematical theory has always been the "when will I ever use this Real Life" attitude from our students. I created this lesson to reinforce the theory of graphing data, calculating an equation of best fit, and formulating a conclusion. Each student will be able to see the usefulness of mathematics in a Real World setting. Common core stand
Subjects:
Grades:
5th - 11th, Adult Education
Types:

Which Speed for Best Gas Mileage? Math in Action series.
Newly revised and improved. What speed will provide the best gas mileage? This lesson was created to reinforce analyzing and graphing data, identify the independent and dependent variable, calculate the slope of the line passing through the points, project rentals from their analysis, and formulate a conclusion. As an optional activity the student is asked to calculate the equation of the line for the data and compare the result to the one presented in the activity. This activity provides ea
Subjects:
Grades:
5th - 11th
Types:
What Dosage Should I Prescribe?
Newly revised and improved. You can purchase many of your “over the counter” medications by just going to your nearby supermarket or convenience store. Many people do not realize that the dosages in these products are for the average person of a certain height and weight. This activity will ask the student look at data related to a person’s weight and the dosage of a certain medication that a doctor has prescribed. As your student works through this lesson, they will be asked to analyze the
Subjects:
Grades:
6th - 11th, Higher Education, Adult Education
Types:
What is the Value of My Photo Copy Machine? The Math in Action Series
Newly revised and improved. What is depreciation? This activity involves the student with the concept of depreciation and future value of items. Topics included are slope, creating a table, graphing data, calculating a linear equation, and projecting values over a period of time. An optional internet project is suggested at the end of the activity. An answer guide is provided.
Many common core standards are covered in this activity.
Some additional activities you may wish to check o
Subjects:
Grades:
6th - 10th, Adult Education
Types:
How Much for Those Fries?
Newly revised and improved. What price should I charge for an order of french fries to maximize my profit? In this activity, the student will be given a total numbe of french fries orders sold at a given price. From this data the student will be asked to analyze this information and present their findings. This lesson will reinforce the theory of graphing data, defining variables, evaluating equations and inequalities using replacement sets, and formulating a conclusion. The use of spreadsh
Subjects:
Grades:
5th - 10th, Adult Education
Types:
Showing 1-7 of 7 results


