2 results
Common Core HSA-REI.D.10 laboratories for Microsoft Word

Concept Comparison: Graphs in Science (Categorical vs Numerical)
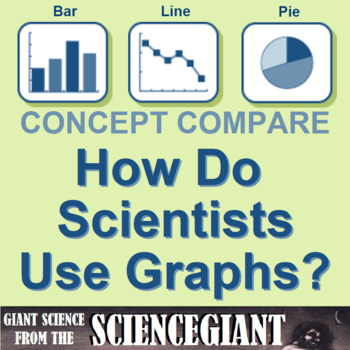
How do scientists use graphs? This concept comparison helps students contrast bar graphs, pie charts and line graphs created from categorical and numerical data. The recall device uses DRY MIX and TRAILS as acronyms to help Ss remember how variables are plotted on a graph, and standard format for a graph. The frame comparison helps students contrast rate of change, slope shape and written relationships of functions (y vs. x; y vs. x^2; y vs. 1/x, and so on). THREE (3) activities are included:ha
Subjects:
Grades:
6th - 12th
NGSS:
HS-ETS1-3
, MS-ETS1-3
Also included in: StayGiant Physics Bundle: Measurement

Whatever floats your boat - demonstrate how math helps us in real-life tasks
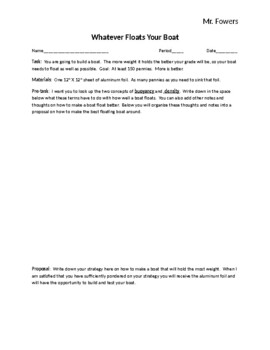
This activity can be used to teach practical applications of everything from early algebra through Calculus. Students will be tasked with building a boat out of aluminum foil to see how many pennies can be held. The mathematics behind the buoyancy of the boat is then discussed and the activity repeated to see quantifiably how much an understanding of mathematics helps us accomplish tasks in the real world.
Subjects:
Grades:
8th - 12th
Types:
Showing 1-2 of 2 results

