15 results
Common Core 7.SP.A.1 laboratories
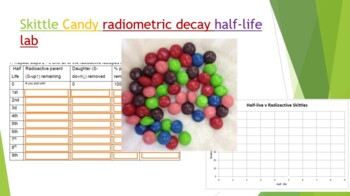
Skittle Radiometric Decay Half-life Lab
Did you know you can use Skittles candy to demonstrate absolute dating and radiometric decay! Buy a 1-4 lb bag at your local bulk warehouse store for savings. This lab is a great way to show how isotopes decay by shaking a plate full of random skittles. Students use Skittles to observe "Isotopes" decay over each half life. At the end of the lab (and only IF they have done all their work) they can enjoy their "daughter products". Skittles were used because they are durable, hypoallergenic, and th
Subjects:
Grades:
8th - 12th, Higher Education, Adult Education
Types:
NGSS:
HS-PS1-8
, HS-PS1-1
, HS-PS1-4
, HS-PS1-6
, MS-PS1-4
...
Also included in: Hands-on Science Semester Labs Bundle
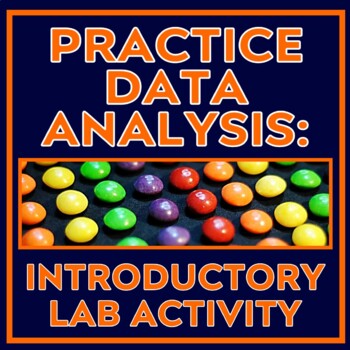
Scientific Method Activity Practice Data Analysis Qualitative and Quantitative
This activity has students collect QUALITATIVE and QUANTITATIVE DATA about the candy in a mixed pack, such as Skittles or M&Ms. There are many candy activities out there, but none quite covered the quantitative and qualitative skills I wanted my middle school students to practice, so I designed my own! This lab is designed to be simple so that students can master beginner lab and data collection skills.In this activity, students will:READ an article about the differences between qualitativ
Subjects:
Grades:
6th - 8th
Types:
Also included in: Introduction to Experimentation Activity Set for Middle School Science
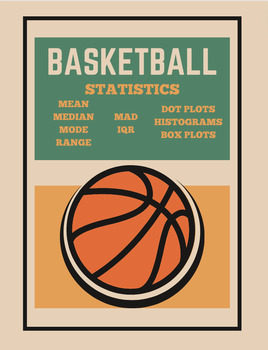
Basketball Statistics Project
Description: Engage your middle school students in the exciting world of basketball while reinforcing math and data analysis skills with this interactive Basketball Stats Project! This comprehensive resource is designed to captivate students' interest in both sports and mathematics, making learning both fun and meaningful.Take your students to the gym or outdoor playground hoop and they'll collect data on "How many baskets can ___ graders make in 60 seconds?" (the template is set to sixth grade
Subjects:
Grades:
5th - 8th
Types:
Bottle Flipping: Math in Motion
As long as the students are going to flip bottles, let’s find the math in it. This measurement, data, and technology activity will keep the students so engaged that they’ll forget that they are learning rigorous math!As a “S.T.E.M. in Action” lesson, you’ll find all four components of a true S.T.E.M. curriculum represented.Science — Students measure mass and compare the behavior of the liquids as they flip the bottle.Technology — Students can build a spreadsheet and use it to collect and aggrega
Subjects:
Grades:
5th - 8th
Types:
NGSS:
MS-ETS1-4
, 3-5-ETS1-1
Create - a - Creature Genetics Unit
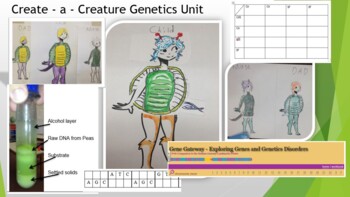
This whole unit covers the basics of genetics! It includes the Create a Creature lab, home genetic test, Punnet Squares, webquest, and final test!You can also extract DNA from dried peas; practice reading DNA and RNA; explore genetic disorders through the Human Genome Project webquest; and explore pedigree charts! You will have to create your own shell and tail pieces this. The original artist has gone on to draw a Google doodle ! You can also have the students design their own shell / tails. Th
Subjects:
Grades:
7th - 12th, Higher Education, Adult Education
Types:
NGSS:
HS-LS3-3
, HS-LS3-1
, MS-LS4-3
, MS-LS4-1
, HS-LS4-2
...
Also included in: Hands-on Science Semester Labs Bundle
Fidget Spinner Tasks
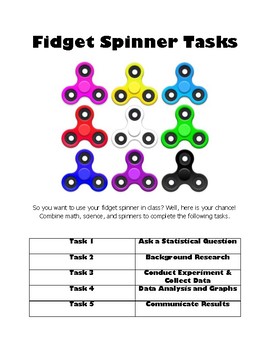
This 5 part lesson combines math, science, and the fidget spinner craze! The five tasks incorporate 6th and 7th grade common core math standards in statistics and some geometry (area/circumference), along with the scientific method and writing.
Task 1: Ask a statistical question
-Includes identifying independent and controlled variables to design experiment fairly
Task 2: Background Research
-Includes drawing, describing qualities, calculating circumference and area of two circles, and weighing
Subjects:
Grades:
6th - 7th
Types:
Drop Zone: Parachute Design Project-Based Learning Lab
This highly adaptable investigation will engage students of many ages and levels. Options for primary, upper elementary, and middle school are included. This is a true STEM lab that incorporates the science, technology engineering, and math components. Common, inexpensive, and easily available materials make this an easy lab to teach yet it produces maximum learning and engagement in your classroom. NGSS and Common Core Math Standards alignment are included in this "STEM on a Shoestring Budget"
Subjects:
Grades:
1st - 8th
Types:
Science Lesson 4: Data for Middle School
Science is driven by the collection and analysis of data. This lesson package provides two days of instructional materials to engage your students. This 42 page visually appealing, editable presentation includes scribble /coloring notes, online guided notes, interactive notebook page, Quizizz review, homework and a hands-on penny lab investigation. Consider using the recorded lesson online for make up or flipping the lesson. It’s all here, use it in its entirety or break up the components t
Grades:
6th - 8th
Types:
Also included in: Science Process Bundle For Middle School
Fidget Spinners: Math in Motion
If a fidget spinner is better at holding a student’s interest than my math lesson, it’s not the fidget spinner than needs to go! Let’s use them to help the students see the math in their everyday life math in a fun and engaging way. Students will gather and interpret data, convert measurements of time, graph data, and even use online software if you wish.As a “S.T.E.M. in Action” lesson, you’ll find all four components of a true S.T.E.M. curriculum represented.Science — Students design an experi
Subjects:
Grades:
6th - 9th
Types:
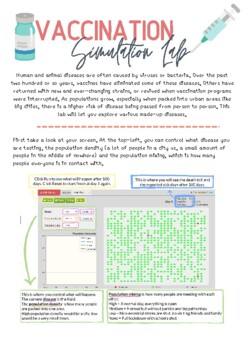
COVID-19 Simulation Lab
Students go to the following website and follow the guide to answer the questions. They look specifically at why social distancing and staying at home works, how population density affects the spread of a virus and how vaccinations can slow the spread. They will answer questions about their thoughts on vaccinations and if they should be required to have one. Website: https://www.learner.org/wp-content/interactive/envsci/disease/disease.html
Grades:
5th - 12th
Types:
NGSS:
HS-LS4-6
, HS-LS4-3
, MS-LS4-4
, MS-LS4-6

Box and Whisker Plot, Scatterplot, Histogram, Stacked Bar Graph of Hurricanes
A Word doc, for customization, of an independent/small-group activity involving an article from NOAA weather, to read, analyze, and draw conclusions based on graphing of real data from NOAA involving hurricanes by decade. Student(s) will make a box plot (box and whisker plot), scatterplot, histogram, and stacked bar graph to support or disagree with the article presented.An Excel sheet with solutions of graphs is provided.Student(s) can work on this independently or in small groups, using graph
Subjects:
Grades:
7th - 8th
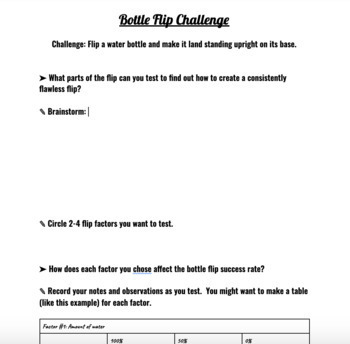
Bottle Flip Challenge - Distance Learning
Students gain a functional understanding of Newton's Laws of Motion by brainstorming, testing, observing, collecting and analyzing data in this STEM activity. Useful as an intro or reference for Laws of Motion Physical Science concepts, data collection & analysis, CER practice, or STEM/scientific process skills. Good For Distance Learning!
Subjects:
Grades:
7th - 12th
Types:
NGSS:
MS-ETS1-4
, MS-PS2-2
, HS-PS2-1
, MS-ETS1-3
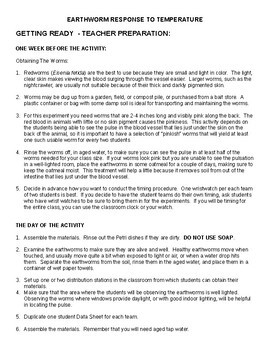
Earthworms Response to Temperature
This is a lab for Middle School and High School Science classes. It uses Red Wigglers, Eisenia fetida, to manipulate temperature variables to affect the worm's pulse rate. Red Wigglers are easy to work with and allow students to see the blow flow through the closed circulatory system and calculate the pulse rate of the worm. This lab uses graphing and data collection to help students understand how science accumulates data to make inferences about how conditions affect animals.
Natural Selection Game
This is a PowerPoint based game that demonstrates the importance of coat coloration for species survival.
Subjects:
Grades:
7th - 12th
Types:
NGSS:
MS-LS4-4
, MS-LS4-6
STATA software Secondary Data Analysis
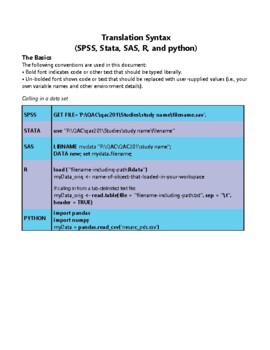
This handout is intended for those interested in teaching/learning basic introductory statistics concepts to analyze real data. Students will learn how to tell a story using secondary data analysis. The handout is for STATA software and the US Longitudinal Study of Adolescent Health data set. For handouts on setting up an account, the data set code book and raw data file, a PowerPoint to accompany the handout, or questions please email kristin.flaming@gmail.com or ldierker@wesleyan.edu.This
Grades:
6th - 12th, Higher Education, Adult Education
Types:
Showing 1-15 of 15 results

