15 results
Common Core 6.SP.B.5b laboratories
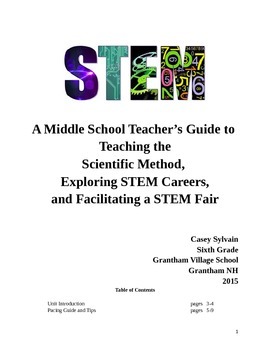
Middle School/Upper Elementary Scientific Method and STEM Fair Unit
This unit was designed as a way to incorporate STEM into a more traditional Science Fair model with connections to STEM careers. Students are encouraged to choose a topic that they are deeply interested in and they learn how to connect scientific thinking to concepts outside of science class. They are also introduced to future STEM careers and community resources. The unit is directly aligned to Next Generation Science Standards (NGSS) and the Common Core.
In order to help students achieve t
Subjects:
Grades:
4th - 11th
Types:
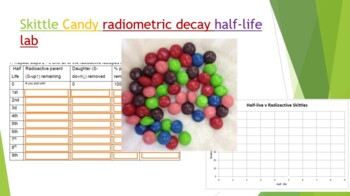
Skittle Radiometric Decay Half-life Lab
Did you know you can use Skittles candy to demonstrate absolute dating and radiometric decay! Buy a 1-4 lb bag at your local bulk warehouse store for savings. This lab is a great way to show how isotopes decay by shaking a plate full of random skittles. Students use Skittles to observe "Isotopes" decay over each half life. At the end of the lab (and only IF they have done all their work) they can enjoy their "daughter products". Skittles were used because they are durable, hypoallergenic, and th
Subjects:
Grades:
8th - 12th, Higher Education, Adult Education
Types:
NGSS:
HS-PS1-8
, HS-PS1-1
, HS-PS1-4
, HS-PS1-6
, MS-PS1-4
...
Also included in: Hands-on Science Semester Labs Bundle
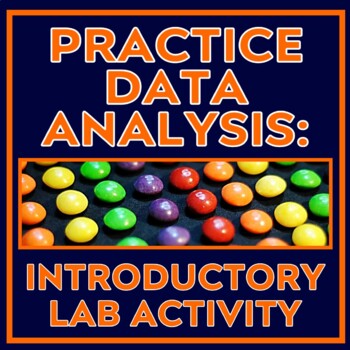
Scientific Method Activity Practice Data Analysis Qualitative and Quantitative
This activity has students collect QUALITATIVE and QUANTITATIVE DATA about the candy in a mixed pack, such as Skittles or M&Ms. There are many candy activities out there, but none quite covered the quantitative and qualitative skills I wanted my middle school students to practice, so I designed my own! This lab is designed to be simple so that students can master beginner lab and data collection skills.In this activity, students will:READ an article about the differences between qualitativ
Subjects:
Grades:
6th - 8th
Types:
Also included in: Introduction to Experimentation Activity Set for Middle School Science
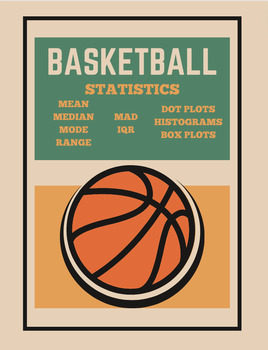
Basketball Statistics Project
Description: Engage your middle school students in the exciting world of basketball while reinforcing math and data analysis skills with this interactive Basketball Stats Project! This comprehensive resource is designed to captivate students' interest in both sports and mathematics, making learning both fun and meaningful.Take your students to the gym or outdoor playground hoop and they'll collect data on "How many baskets can ___ graders make in 60 seconds?" (the template is set to sixth grade
Subjects:
Grades:
5th - 8th
Types:
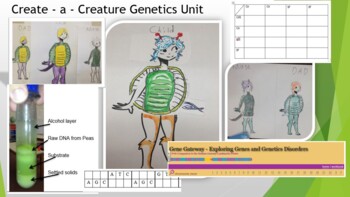
Create - a - Creature Genetics Unit
This whole unit covers the basics of genetics! It includes the Create a Creature lab, home genetic test, Punnet Squares, webquest, and final test!You can also extract DNA from dried peas; practice reading DNA and RNA; explore genetic disorders through the Human Genome Project webquest; and explore pedigree charts! You will have to create your own shell and tail pieces this. The original artist has gone on to draw a Google doodle ! You can also have the students design their own shell / tails. Th
Subjects:
Grades:
7th - 12th, Higher Education, Adult Education
Types:
NGSS:
HS-LS3-3
, HS-LS3-1
, MS-LS4-3
, MS-LS4-1
, HS-LS4-2
...
Also included in: Hands-on Science Semester Labs Bundle
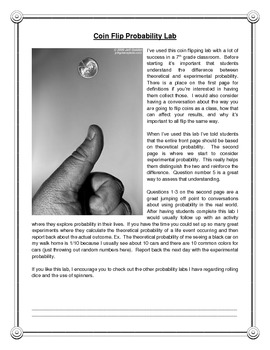
Probability Math Lab - Coin Flipping
This is a one day Math Lab to explore theoretical and experimental probability through flipping coins. Students determine the theoretical probability of a few scenarios and then experiment to see what happens. It comes with a couple pointers on how to preface the lesson and where to go when you're finished. Aligned to the Common Core Standards for Math.
Subjects:
Grades:
6th - 8th
Types:
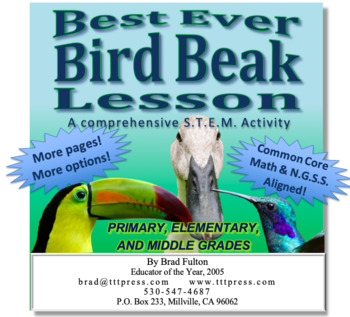
Best Ever Bird Beak Lesson
Students will enjoy participating in this engaging exploration that helps them understand the diversity of the animal kingdom and the concept of adaptation. They will mimic the feeding habits of birds with various types of beaks to learn how species have adapted to their environments. Options allow the lesson to be extended through the grade levels from primary to middle school and into math, technology, and engineering for a full S.T.E.M. experience.
Grades:
K - 6th
NGSS:
3-LS4-3
, 3-LS3-2
, 3-LS3-1
, MS-LS4-6
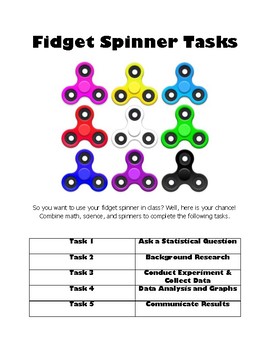
Fidget Spinner Tasks
This 5 part lesson combines math, science, and the fidget spinner craze! The five tasks incorporate 6th and 7th grade common core math standards in statistics and some geometry (area/circumference), along with the scientific method and writing.
Task 1: Ask a statistical question
-Includes identifying independent and controlled variables to design experiment fairly
Task 2: Background Research
-Includes drawing, describing qualities, calculating circumference and area of two circles, and weighing
Subjects:
Grades:
6th - 7th
Types:
Drop Zone: Parachute Design Project-Based Learning Lab
This highly adaptable investigation will engage students of many ages and levels. Options for primary, upper elementary, and middle school are included. This is a true STEM lab that incorporates the science, technology engineering, and math components. Common, inexpensive, and easily available materials make this an easy lab to teach yet it produces maximum learning and engagement in your classroom. NGSS and Common Core Math Standards alignment are included in this "STEM on a Shoestring Budget"
Subjects:
Grades:
1st - 8th
Types:
Fidget Spinners: Math in Motion
If a fidget spinner is better at holding a student’s interest than my math lesson, it’s not the fidget spinner than needs to go! Let’s use them to help the students see the math in their everyday life math in a fun and engaging way. Students will gather and interpret data, convert measurements of time, graph data, and even use online software if you wish.As a “S.T.E.M. in Action” lesson, you’ll find all four components of a true S.T.E.M. curriculum represented.Science — Students design an experi
Subjects:
Grades:
6th - 9th
Types:
Cone Zone: A Comprehensive S.T.E.A.M. Activity
Students will design a cone-shaped descent chute for a planetary landing craft to optimize stability and minimize speed in this engaging lesson. This activity lends itself to student scientists of many ages. Young learners will benefit from simply creating the cones and testing their effectiveness. Older students can use spreadsheets that they create to analyze the data on a much more sophisticated level.
Grades:
5th - 9th
Types:
CCSS:
NGSS:
MS-ETS1-2
, 3-5-ETS1-3
, MS-ETS1-4
, 3-5-ETS1-2
, MS-ETS1-3
Math Lab Theoretical and Experimental Probability
Welcome to Kindly Pass the Math! * The following Math Lab is offered as an experimental approach to the relationship between Theoretical and Experimental Probability.A brief explanation defining both Theoretical Probability and Experimental Probability.* Students are introduced to the common terms used in probability calculations: Trial, Outcome, Event.* Students draw chips or marbles from a container and record their results on the Data Recording Sheets provided in the lab. * The lab pro
Subjects:
Grades:
7th - 10th, Adult Education
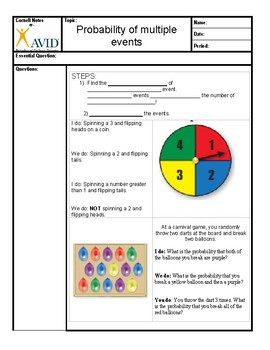
Bean Boozled Probability lab and Cornell Notes
This product is a lesson in probability using Bean Boozled. Buy the beans and let students calculate the probability of getting a yucky flavor! The Powerpoint presentation is to accompany is below.Bean Boozled Powerpoint PresentationBean Boozled Bundle
Subjects:
Grades:
5th - 8th
Also included in: Bean Boozled Probability Bundle
Exploring Potential/Kinetic Energy_Helicopter Lab
A GREAT introductory activity to potential and kinetic energy with a full review of scientific variables!
Grades 6-8
NGSS Standards :
MS-PS3-2. Develop a model to describe that when the arrangement of
objects interacting at a distance changes, different amounts of potential
energy are stored in the system.
MS-PS3-5. Construct, use, and present arguments to support the claim
that when the kinetic energy of an obj
Grades:
6th - 8th
Types:
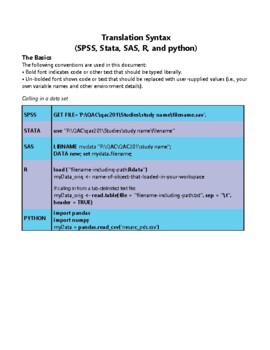
STATA software Secondary Data Analysis
This handout is intended for those interested in teaching/learning basic introductory statistics concepts to analyze real data. Students will learn how to tell a story using secondary data analysis. The handout is for STATA software and the US Longitudinal Study of Adolescent Health data set. For handouts on setting up an account, the data set code book and raw data file, a PowerPoint to accompany the handout, or questions please email kristin.flaming@gmail.com or ldierker@wesleyan.edu.This
Grades:
6th - 12th, Higher Education, Adult Education
Types:
Showing 1-15 of 15 results

