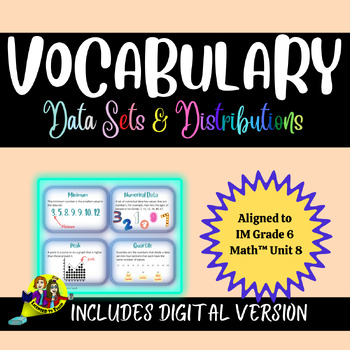
Vocabulary Cards Illustrative Math, 6th, Data Sets & Distribution, Digital/Print
- PDF
Also included in
- Enhance your 6th-grade students' mastery of essential mathematical concepts with our comprehensive bundle of Vocabulary Cards, meticulously designed to align seamlessly with the Illustrative Mathematics curriculum. These versatile cards serve as valuable resources, empowering students to independentPrice $21.00Original Price $26.00Save $5.00
Description
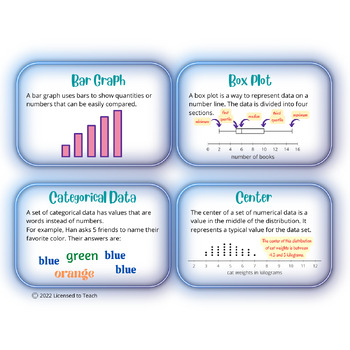
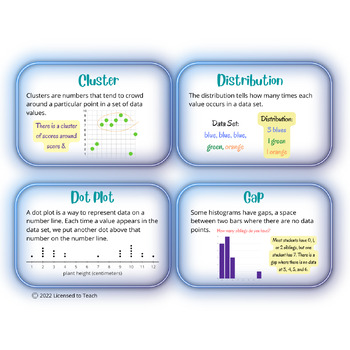
These vocabulary words are the new terminology that sixth grade students are expected to produce in their own speaking and writing while working through the Data Sets & Distributions Unit in the Illustrative Mathematics curriculum. I like to use the vocabulary cards as individual anchor charts/resource for students. You could cut them into individual cards and staple or punch them and put on a book ring. If your students have access to devices, the vocabulary cards also come as a Google Slides presentation.
One of the most effective ways to improve test scores, writing, and reading comprehension is to improve vocabulary! Five fun vocabulary game ideas are included. An example using the Frayer model is also included, with a blank sheet for students to practice using this strategy.
Vocabulary words included (Unit 8):
1. bar graph
2. box plot
3. categorical data
4. center
5. cluster
6. distribution
7. dot plot
8. gap
9. histogram
10. interquartile range (IQR)
11. maximum
12. mean
13. mean absolute deviation (MAD)
14. measure of center
15. measure of spread
16. median
17. minimum
18. numerical data
19. peak
20. quartile
21. range
22. spread
23. statistical question
24. symmetrical
25. typical
26. unusual value
27. variability
Terms of Use
- All pages within this resource are copyrighted. Please do not create or sell anything based on the content within this file.
- This item is for the use of one teacher only. If you have shared this with colleagues, please direct them to our TPT store.
- We approve the use of the cover photo/page of this file in order to promote on social media, blog, facebook, twitter, etc. This should be done with an active link directed back to our TPT store.
- As this is a digital resource, returns will not be provided. Any issues with printing should be directed towards the TPT help desk.
- All terms are subject to change without notice.

