
Scatter Plots Stations Activity | Lines of Best Fit, Correlation & Analyze


Make Sense of Math
4.7k Followers
Grade Levels
8th - 9th, Homeschool
Subjects
Resource Type
Standards
CCSS8.SP.A.1
CCSS8.SP.A.2
CCSS8.SP.A.3
Formats Included
- PDF
Pages
14 pages
Make Sense of Math
4.7k Followers
What educators are saying
This has been really helpful for my students because they were able to have a deeper understanding of the concepts.
Also included in
 Looking to add variety to your classroom? These middle school math stations are just what you need for your students to develop a deep understanding of mathematics. Includes math stations in the topics of number systems, expressions, equations, functions, ratios, proportional relationships, probabiPrice $67.00Original Price $98.00Save $31.00
 Looking for ways to simplify planning while continuing to teach in-depth lessons? This 8th grade math curriculum and activities bundle is for you! This math curriculum is aligned to the 8th grade common core standards. Each unit includes: guided notes, assessments/worksheets and activities such as:Price $200.00Original Price $339.00Save $139.00
 These 8th grade math stations are just what you need to help your students develop a deep understanding of mathematics. The focus of these math stations is for students to discover and apply mathematical principles. The students will dive into the mathematics and gain a strong foundation. These coPrice $19.00Original Price $24.00Save $5.00
 These 8th grade math stations are just what you need to help your students develop a deep understanding of mathematics. There are at least four stations in each set. The focus of these stations is for students to discover and apply mathematical principles. The students will delve into the mathemaPrice $30.00Original Price $43.00Save $13.00
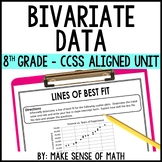 This bivariate data unit includes notes, assessments, and stations. This is perfect for your students to dive into scatter plots, lines of best fit and two-way frequency tables. In-depth notes to teach and fun activities to supplement. Aligned to 8th grade math CCSSBy purchasing this bundle, you arePrice $18.00Original Price $27.00Save $9.00
 You are going to love these fun 8th grade math activities to supplement your curriculum. These 8th grade math activities includes: stations, task cards, mystery pictures and more. These activities cover a variety of 8th grade math topics so that you can use them throughout the year. Check Out WhatPrice $90.00Original Price $120.50Save $30.50
Description
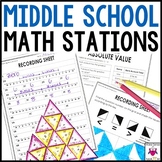
These math stations delve into scatter plots with a focus on correlation and informally analyzing lines of best fit. Students will create, analyze, estimate and explain. Students will develop a deep understanding of this content after completing these math stations.
The following stations are included:
- Create and Analyze: Students will create and analyze a scatter plot. Noticing correlation, outliers and clusters.
- Lines of Best Fit: Students are given a scatter plot and are to informally draw and write an equation for a line of best fit. This is done by estimating not by actually calculating. They will then use the line of best fit to make predictions.
- Sketching Correlations: Students will sketch various scatter plots given certain correlations.
- Correlation Situations: Given situations, students will determine the type of correlation and will also create situations for certain correlations.
- Letter Writing: Students will write a letter to their friend about everything they learned about lines of best fit.
Other Products you may be Interested in
▸ 8th Grade Math Statistics & Probability Common Core Mini Assessments
★ FOLLOW ME for more great products to make sense of math!
Remember that leaving feedback earns you points toward FREE TPT purchases!
Please feel free to contact me with any questions!
Michelle,
Make Sense of Math
makesenseofmath@yahoo.com
Total Pages
14 pages
Answer Key
Included
Teaching Duration
N/A
Report this resource to TPT
Reported resources will be reviewed by our team. Report this resource to let us know if this resource violates TPT’s content guidelines.
Standards
to see state-specific standards (only available in the US).
CCSS8.SP.A.1
Construct and interpret scatter plots for bivariate measurement data to investigate patterns of association between two quantities. Describe patterns such as clustering, outliers, positive or negative association, linear association, and nonlinear association.
CCSS8.SP.A.2
Know that straight lines are widely used to model relationships between two quantitative variables. For scatter plots that suggest a linear association, informally fit a straight line, and informally assess the model fit by judging the closeness of the data points to the line.
CCSS8.SP.A.3
Use the equation of a linear model to solve problems in the context of bivariate measurement data, interpreting the slope and intercept. For example, in a linear model for a biology experiment, interpret a slope of 1.5 cm/hr as meaning that an additional hour of sunlight each day is associated with an additional 1.5 cm in mature plant height.
Reviews
Questions & Answers
4.7k Followers
