TPT
Total:
$0.00

Measurement Galore - Reading a Tape Measure

Rated 4.67 out of 5, based on 3 reviews
4.7 (3 ratings)
;
Grade Levels
3rd - 12th, Higher Education, Adult Education, Homeschool
Resource Type
Standards
Formats Included
  • Google Slides™
Pages
25 pages
$4.00
$4.00
Share this resource
Report this resource to TPT
Made for Google Drive™
This resource can be used by students on Google Drive or Google Classroom. To access this resource, you’ll need to allow TPT to add it to your Google Drive. See our FAQ and Privacy Policy for more information.
Easel Activity Included
This resource includes a ready-to-use interactive activity students can complete on any device.  Easel by TPT is free to use! Learn more.

Description

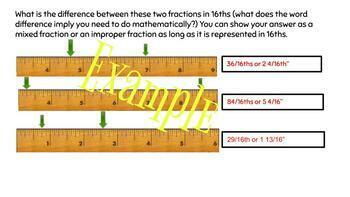
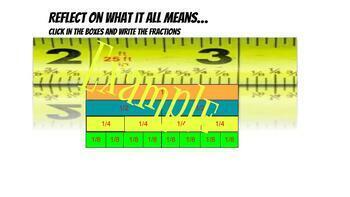
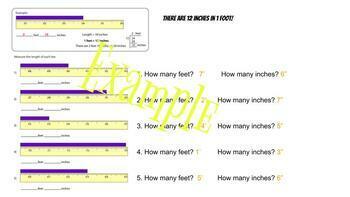
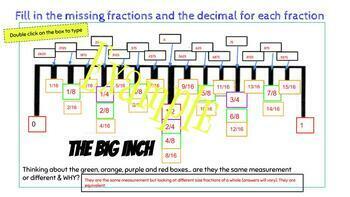
This product come from struggling to teach students how to use the measuring tape and how to understand the fractions on a measuring tape. It has multiple representations of reading fractions on a measuring tape and fraction bar. It has spaces to type in answers and printable test pages to assess learning. It shows multiple ways to represent the same fraction (equivalent fractions). It is fun, yet rigorous. I included websites where your students can go to play online measurement games and videos to help reinforce skills. This is a presentation I go back to over and over again when working with students in a career tech education classroom but could easily be used in a regular math classroom or with students that have special needs. There is a full slide presentation with all the answer as well - you will find the link to the answer key on the last page of the slide in the presenters notes section.

Total Pages
25 pages
Answer Key
Included
Teaching Duration
N/A
Report this resource to TPT
Reported resources will be reviewed by our team. Report this resource to let us know if this resource violates TPT’s content guidelines.

Standards

to see state-specific standards (only available in the US).
Draw a scaled picture graph and a scaled bar graph to represent a data set with several categories. Solve one- and two-step “how many more” and “how many less” problems using information presented in scaled bar graphs. For example, draw a bar graph in which each square in the bar graph might represent 5 pets.
Generate measurement data by measuring lengths using rulers marked with halves and fourths of an inch. Show the data by making a line plot, where the horizontal scale is marked off in appropriate units-whole numbers, halves, or quarters.
Make a line plot to display a data set of measurements in fractions of a unit (1/2, 1/4, 1/8). Solve problems involving addition and subtraction of fractions by using information presented in line plots. For example, from a line plot find and interpret the difference in length between the longest and shortest specimens in an insect collection.
Make a line plot to display a data set of measurements in fractions of a unit (1/2, 1/4, 1/8). Use operations on fractions for this grade to solve problems involving information presented in line plots. For example, given different measurements of liquid in identical beakers, find the amount of liquid each beaker would contain if the total amount in all the beakers were redistributed equally.
Model with mathematics. Mathematically proficient students can apply the mathematics they know to solve problems arising in everyday life, society, and the workplace. In early grades, this might be as simple as writing an addition equation to describe a situation. In middle grades, a student might apply proportional reasoning to plan a school event or analyze a problem in the community. By high school, a student might use geometry to solve a design problem or use a function to describe how one quantity of interest depends on another. Mathematically proficient students who can apply what they know are comfortable making assumptions and approximations to simplify a complicated situation, realizing that these may need revision later. They are able to identify important quantities in a practical situation and map their relationships using such tools as diagrams, two-way tables, graphs, flowcharts and formulas. They can analyze those relationships mathematically to draw conclusions. They routinely interpret their mathematical results in the context of the situation and reflect on whether the results make sense, possibly improving the model if it has not served its purpose.

Reviews

Questions & Answers