
Interval in Excel


- Zip
- Excel Spreadsheets
Also included in
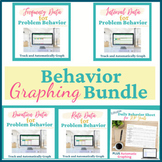 Introducing the comprehensive Behavior Measurement Graphing Bundle - your ultimate solution for effectively collecting and tracking classroom behavior data with ease. This all-in-one package empowers teachers like you to measure and graph various behavior aspects, including frequency, rate, durationPrice $24.00Original Price $30.00Save $6.00
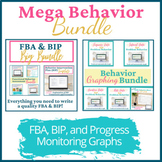 FBA, BIP, Progress Monitoring (Mega Bundle) includes everything for the FBA BIP Bundle, PLUS progress monitoring/graphing resources!What's IncludedFBA Interview FormsFBA Parent Interview FormFBA Teacher Interview FormFBA Student Interview FormFBA Behavior Observation FormsAnecdotal Observation NotesPrice $58.40Original Price $73.00Save $14.60
Description
Interval in Excel - Track Student Behaviors That Are Too Frequent for Frequency Count
Interval in Excel is an effective tool for tracking student behaviors that are too frequent for frequency count, such as calling out or making repetitive noises. This product is designed to help you quantify behavior data, save time, and clearly demonstrate the need for additional support to your administration.
How to Use Interval in Excel
To use Interval in Excel, select a partial interval behavior data collection sheet where the day is divided into 5-minute or 10-minute segments. Simply indicate with a plus sign whether the behavior occurred even once during that time period.
At the end of the day, calculate the percentage of intervals in which the behavior was observed by dividing the total number of intervals in which the behavior occurred by the total number of intervals.
Your purchase of Interval in Excel includes:
- 6 different Interval Recording Forms
- Daily Behavior Interval Excel Graphs through the 2025-2026 school year
- Common Data Collection Methods Quick Overview
- Quick Excel Tips
- Example Behavior Graph with Phase Line and Trend Line
Add Phase Lines to Your Graph
Increase the usefulness of your graph by using phase lines. Add a phase line to the graph when changes occur, such as medication changes, class changes, or living situations. Over time, you can use this information to identify potential causes of behavioral difficulties or reasons for behavior improvement.
Using phase lines can be especially helpful when working with students who have a Behavior Intervention Plan. They help you determine the effectiveness of your interventions. Instructions on how to use phase lines are included in your purchase.
Note: While the graph can work on both Excel and Google Sheets, phase lines can only be added using Excel.
If you like Interval in Excel, you might also be interested in my other behavior graphing resources, which can be found here.
If you are looking for just forms but aren't interested in graphing, I have a resource for that, too!
Forms:
- Behavior Data Collection Sheet (s) - 38 Individual Data Sheets
- Classroom Data Collection Sheet (s) For Academics, Digital and Printable
- Progress Monitoring for IEP Goals - Behavior and Academics - Featured
Blog Posts to Learn More About Behavior Data Collection
- How to Use Behavioral Baseline Data to Promote and Measure Student Growth
- How to Use Frequency Count in Excel to Progress Monitor Classroom Behavior
- Duration of Behavior: How to Use Duration Count to Effectively Track Student Behavior
- Interval Graphing for Student Success: A Step-by-Step Guide for Educators
- Behavioral Progress Tracking: The Power of Rate Graphs in Education
Connect with Me!
Please follow me on TPT for more exceptional data collection and SEL resources. And remember, your feedback matters! If you decide to make a purchase, kindly leave a review, and TPT will reward you with credits to explore more fabulous resources. Together, let's create a positive and data-informed learning environment for our students.
