Data Analysis (Statistics) Poem/Rap and Graphic Organizer (G.L.A.D. Strategy)
- PDF
Description
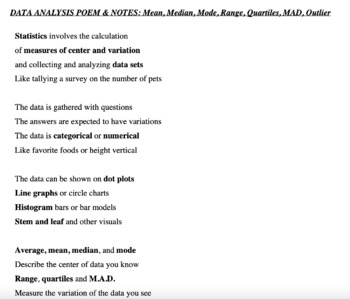
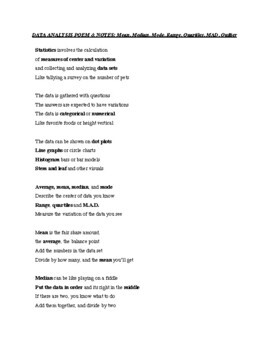
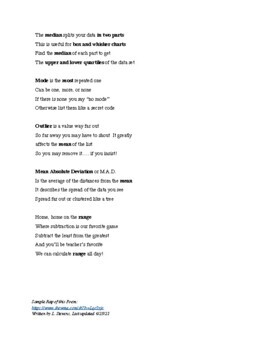
Data Analysis Rap/Poem and Notes
(G.L.A.D. Strategy for Vocabulary Development)
Objectives and Strategies:
This poem or rap type chant is a G.L.A.D. strategy (Guided Language Acquisition Design) for introducing and developing academic vocabulary for a unit of study with students on statistics at the 6th grade level. This is especially helpful for English Language Learners with oral language development, and is great for all students.
The idea is to have students read this as a poem and/or sing it like a rap multiple times at the beginning of a unit and throughout the unit to develop and reinforce the academic vocabulary. This is intended for a 6th grade level introduction to statistics (data analysis and data display).
Students will feel comfortable trying out the new vocabulary as they read or sing out loud together in a fun way, lowering their affective filter (reducing anxiety). The song sheet can be used as a graphic organizer to take notes on the measures of center and variation using a sample data set, or a real one by surveying the students in class to collect numerical data.
When first reading or singing this with students, start slow, and consider using a “repeat after me” strategy so that students will feel comfortable speaking the new vocabulary words. This can be done with the whole class, and/or in small groups. One way to use groups is to have each student group read and figure out how to rap their assigned portion of the poem, and then have each group lead the class in that portion of the poem during a whole class session when ready. Students will come up with very creative ways to rap the poem!
When I use this with students, I hear them singing parts of the poem/rap to remember how to find the median, mode, etc. When students ask me a question, I’ll sing them back an answer as well to make it fun and trigger their memory.
Attachments, Links Provided with Purchase:
1) Blank version of Data Analysis Poem (or Rap) handout for students and/or for display on the projector in class.
2) Graphic Organizer version of the poem (or rap) with a sample data set provided for student to take notes on.
3) Sample filled in graphic organizer using sample data set (for teacher use).
4) Link to a sample of how the poem can be rapped with generic background instrumental music.


