Create a Pizza Shop Project: Math and ELA CCSS Aligned
More Than Elementary Shop
107 Followers
Grade Levels
3rd - 4th
Subjects
Resource Type
Standards
CCSS3.MD.B.3
CCSS3.MD.C.6
CCSS3.MD.C.7a
CCSS3.OA.A.2
CCSS3.NF.A.1
Formats Included
- PDF
Pages
41 pages
More Than Elementary Shop
107 Followers
Description
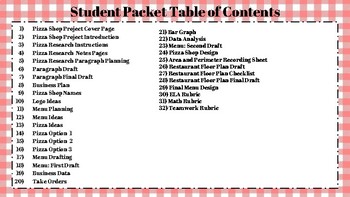
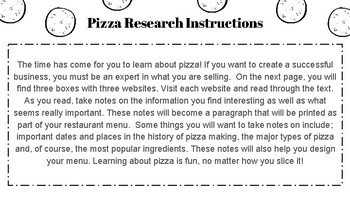
Are you looking for a project that students can do in groups that is fun, engaging and reviews several standards? This project allows students to research pizza by reading non fiction text (web based and accessible to all), taking notes and writing an informational paragraph. Groups will then move into designing their own pizza shop. They will make logos, menus, a floor plan and so much more. Students will learn how to collect data on their ideas and reflect to improve their business. Included in this product: Teacher tips, a list of standards and how they are used, a reading list including book club books as well as a comprehensive packet that is ready to print, copy and go! Students love the creativity and collaboration. You will also find three simple rubrics to give you students feedback. One for ELA, one for math and one for teamwork.
Skills covered in this engaging project:
- Fractions
- Graphing and data collection
- Division
- Area and Perimeter
- Informational reading and writing
Not to mention the invaluable skills that are learned when students collaborate as a team. This packet is ready for your students to take and run with. Minimal instruction is needed as each section comes with directions. Perfect for the end of a trimester, near a break or during testing when you want to give your students time to get up and move, talk and be creative. Your math, reading, writing and art stars can all have a chance to shine with this project.
Total Pages
41 pages
Answer Key
N/A
Teaching Duration
2 Weeks
Report this resource to TPT
Reported resources will be reviewed by our team. Report this resource to let us know if this resource violates TPT’s content guidelines.
Standards
to see state-specific standards (only available in the US).
CCSS3.MD.B.3
Draw a scaled picture graph and a scaled bar graph to represent a data set with several categories. Solve one- and two-step “how many more” and “how many less” problems using information presented in scaled bar graphs. For example, draw a bar graph in which each square in the bar graph might represent 5 pets.
CCSS3.MD.C.6
Measure areas by counting unit squares (square cm, square m, square in, square ft, and improvised units).
CCSS3.MD.C.7a
Find the area of a rectangle with whole-number side lengths by tiling it, and show that the area is the same as would be found by multiplying the side lengths.
CCSS3.OA.A.2
Interpret whole-number quotients of whole numbers, e.g., interpret 56 ÷ 8 as the number of objects in each share when 56 objects are partitioned equally into 8 shares, or as a number of shares when 56 objects are partitioned into equal shares of 8 objects each. For example, describe a context in which a number of shares or a number of groups can be expressed as 56 ÷ 8.
CCSS3.NF.A.1
Understand a fraction 1/𝘣 as the quantity formed by 1 part when a whole is partitioned into 𝘣 equal parts; understand a fraction 𝘢/𝑏 as the quantity formed by 𝘢 parts of size 1/𝘣.


