Business Linear Project
Teaching for Understanding
90 Followers
Resource Type
Standards
CCSS8.F.A.2
CCSS8.F.A.3
CCSS8.F.B.4
CCSSHSF-IF.B.4
CCSSHSF-IF.B.6
Formats Included
- Zip
Pages
10 pages
Teaching for Understanding
90 Followers
Description
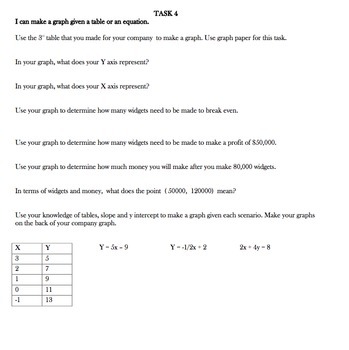
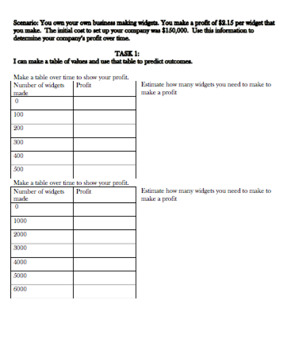
This is a 9 task project that can take anywhere from 5-15 days depending on your class' knowledge. This project focuses on owning your business and using that data to learn the following objectives
1) Graph a line given data, given an equation or a table
2) Determine the equation from a graph, equation or table
3) Write an equation given 2 points.
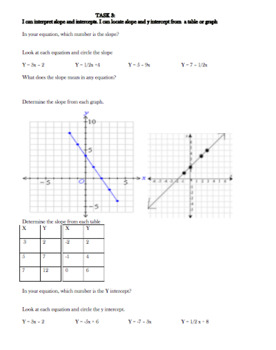
4) Interpret slope, y intercept and x intercepts
5) Write the equation of a line parallel
6) Graph a scatter plot and interpret that data.
Total Pages
10 pages
Answer Key
N/A
Teaching Duration
1 Week
Report this resource to TPT
Reported resources will be reviewed by our team. Report this resource to let us know if this resource violates TPT’s content guidelines.
Standards
to see state-specific standards (only available in the US).
CCSS8.F.A.2
Compare properties of two functions each represented in a different way (algebraically, graphically, numerically in tables, or by verbal descriptions). For example, given a linear function represented by a table of values and a linear function represented by an algebraic expression, determine which function has the greater rate of change.
CCSS8.F.A.3
Interpret the equation 𝘺 = 𝘮𝘹 + 𝘣 as defining a linear function, whose graph is a straight line; give examples of functions that are not linear. For example, the function 𝘈 = 𝑠² giving the area of a square as a function of its side length is not linear because its graph contains the points (1,1), (2,4) and (3,9), which are not on a straight line.
CCSS8.F.B.4
Construct a function to model a linear relationship between two quantities. Determine the rate of change and initial value of the function from a description of a relationship or from two (𝘹, 𝘺) values, including reading these from a table or from a graph. Interpret the rate of change and initial value of a linear function in terms of the situation it models, and in terms of its graph or a table of values.
CCSSHSF-IF.B.4
For a function that models a relationship between two quantities, interpret key features of graphs and tables in terms of the quantities, and sketch graphs showing key features given a verbal description of the relationship.
CCSSHSF-IF.B.6
Calculate and interpret the average rate of change of a function (presented symbolically or as a table) over a specified interval. Estimate the rate of change from a graph.


