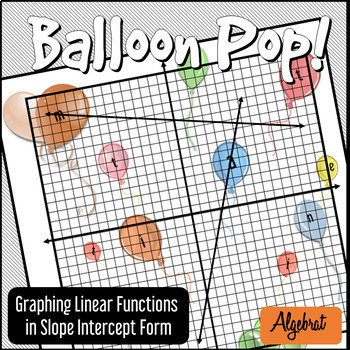
BALLOON POP! - Graphing Linear Functions! - Slope Intercept OR Standard Form
The Algebrat
104 Followers
Resource Type
Standards
CCSS8.F.A.3
CCSSHSF-IF.C.7a
Formats Included
- Zip
Pages
4 pages
The Algebrat
104 Followers
What educators are saying
Really fun exercises to learn how to graph linear functions. My homeschooler enjoyed popping the balloons!
I, as well as my students, love activities like this. It also allows for self checking (my student knew there was a mistake when a line didn't intersect a balloon or when a line intersected more than one balloon)
Description
Hello Algebrats!
BALLOON POP is a fun and engaging worksheet for students to practice and master graphing linear functions in slope intercept form (or challenge students by giving them the worksheet in standard form to convert to slope-intercept first)!
Engage students as they try and crack the puzzle on the back, by graphing linear functions and popping each balloon the line passes through! As they pop each balloon, they write that letter in the corresponding number in the puzzle!
Students are challenged to graph in both directions, placing multiple points on each line and refining their accuracy in graphing.
★ Included ★
- Balloon Pop Activity: Two options: One in Slope-Intercept Form, and one in Standard Form for students to convert to Slope-Intercept Form before graphing!
- Keys: Answer keys for both Slope Intercept and Standard Form
- Warm Up: Warm up and answer key to prepare students for activity
Thank you so much for viewing this product, and I hope it allows your students to have fun while learning!
Total Pages
4 pages
Answer Key
Included
Teaching Duration
1 hour
Last updated Jan 20th, 2022
Report this resource to TPT
Reported resources will be reviewed by our team. Report this resource to let us know if this resource violates TPT’s content guidelines.
Standards
to see state-specific standards (only available in the US).
CCSS8.F.A.3
Interpret the equation 𝘺 = 𝘮𝘹 + 𝘣 as defining a linear function, whose graph is a straight line; give examples of functions that are not linear. For example, the function 𝘈 = 𝑠² giving the area of a square as a function of its side length is not linear because its graph contains the points (1,1), (2,4) and (3,9), which are not on a straight line.
CCSSHSF-IF.C.7a
Graph linear and quadratic functions and show intercepts, maxima, and minima.


