6 results
Mental math Common Core 5.MD.B.2 lessons

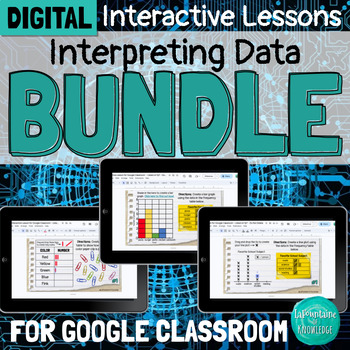
DIGITAL Interpreting Data Interactive Lesson Bundle for Google Classroom
This bundle of 3 digital interactive math lessons for Google Classroom teaches interpreting categorical and numerical data using frequency tables, bar graphs, and line plots. Each lesson includes: a video lesson (YouTube and Loom viewing options included) practice problems and activitiesteacher directions and answer keysThese lessons are ready to assign and easy for students to complete independently. Students will learn:important vocabulary - title, categories, tally marks, key, categorical dat
Subjects:
Grades:
3rd - 5th
Types:

Line Plots Interpreting Categorical and Numerical Data Google Slides Lesson
This Google Slides math lesson introduces students to line plots that are used to organize, graph, and interpret both categorical and numerical data. It also includes scaled line plots. This lesson:reviews frequency tables as a way of keeping track of dataexplains the parts of a line plot including title, categories, and keydemonstrates how to create a line plot using the data from a frequency table by adding x's to represent the dataexplains the difference between categorical and numerical data
Subjects:
Grades:
3rd - 5th
Types:

5th Grade Math Common Core Warm-Up Program
5th Grade Math Common Core Warm-Up Program
Revisit the Standards Throughout the School Year
I am excited to introduce a set of 120 daily warm-ups that can be used to support and to implement the teaching of the Common Core Math Standards. To fully understand the scope of this program please click the link below to see the preview pages.
In the 5th Grade Math Common Core Warm-Up Program Preview Pages you will find the Teacher Introduction, Common Core correlations, and 11 actual pages from th
Subjects:
Grades:
5th
Types:

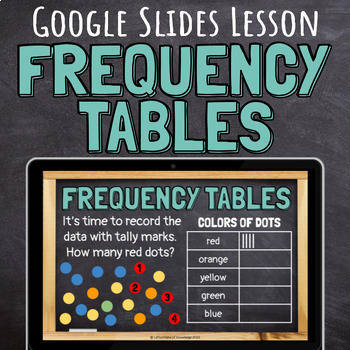
Frequency Tables Interpreting Categorical and Numerical Data Google Slides
This Google Slides math lesson introduces students to frequency tables that are used to organize and interpret both categorical and numerical data. This lesson:explains the parts of a frequency table (title, categories, tally marks)demonstrates how to count tally marks explains the difference between categorical and numerical dataprovides questions to practice interpreting both types of data (just click to reveal the answers) models how to create a frequency table to organize and display dataThe
Subjects:
Grades:
3rd - 5th
Types:

Bar Graphs Interpreting Categorical and Numerical Data Google Slides Lesson
This Google Slides math lesson introduces students to bar graphs that are used to organize and interpret both categorical and numerical data. It also includes scaled bar graphs. This lesson:reviews frequency tables as a way of keeping track of dataexplains the parts of a bar graph including title and categoriesdemonstrates how to create a bar graph using the data from a frequency table by shading in the bars explains the difference between categorical and numerical dataprovides questions to prac
Subjects:
Grades:
3rd - 5th
Types:

EnVision Number Talk Google Slides for 5th Grade Topic 10 (Interpret Data)
Use these Number Talk Slides to begin each EnVision lesson. These slides build mathematical literacy and create rich classroom discussion before digging deeper into the each lesson objective. Using these slides before each lesson better equips students to reach the lesson target. Students will engage in meaningful discussions about numbers and how they relate to the topic and lesson. These Google lesson Slides are designed to be used with an Interactive Whiteboard but can also work with a tv.T
Subjects:
Grades:
5th
CCSS:
Also included in: EnVision Topic 10 (Interpret Data) Resource Bundle - 5th Grade
Showing 1-6 of 6 results


