TPT
Total:
$0.00

Frequency Tables Interpreting Categorical and Numerical Data Google Slides

;
LaFountaine of Knowledge
3.9k Followers
Grade Levels
3rd - 5th
Resource Type
Standards
Formats Included
  • Google Slides™
Pages
30 pages
$3.50
$3.50
Share this resource
Report this resource to TPT
LaFountaine of Knowledge
3.9k Followers
Made for Google Drive™
This resource can be used by students on Google Drive or Google Classroom. To access this resource, you’ll need to allow TPT to add it to your Google Drive. See our FAQ and Privacy Policy for more information.

Description

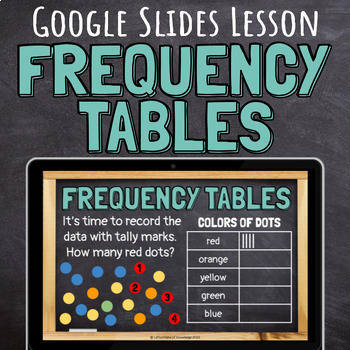
This Google Slides math lesson introduces students to frequency tables that are used to organize and interpret both categorical and numerical data.

This lesson:

  • explains the parts of a frequency table (title, categories, tally marks)
  • demonstrates how to count tally marks
  • explains the difference between categorical and numerical data
  • provides questions to practice interpreting both types of data (just click to reveal the answers)
  • models how to create a frequency table to organize and display data

These slides are fully editable so you can tweak them to fit your needs. Be sure to check the preview file for a closer look at this lesson (Note: the Google Slides feature animations that will not work in the PDF preview file but it will still give you a good idea of what's included in the lesson).

Please follow my store here for more great resources!

You can also find me on Facebook, Instagram, and lafountaineofknowledge.com where you'll discover ideas, inspiration, and plenty of freebies! Or join my email list to get a monthly newsletter with exclusive FREE resources you can't get anywhere else!

Want free money to spend on Teachers Pay Teachers? Rate this product to earn some TpT credit! Leaving feedback helps us both out and takes less than a minute! Your support makes it possible for me to continue making and sharing great resources! Thank you!

Total Pages
30 pages
Answer Key
Included
Teaching Duration
30 minutes
Report this resource to TPT
Reported resources will be reviewed by our team. Report this resource to let us know if this resource violates TPT’s content guidelines.

Standards

to see state-specific standards (only available in the US).
Draw a scaled picture graph and a scaled bar graph to represent a data set with several categories. Solve one- and two-step “how many more” and “how many less” problems using information presented in scaled bar graphs. For example, draw a bar graph in which each square in the bar graph might represent 5 pets.
Generate measurement data by measuring lengths using rulers marked with halves and fourths of an inch. Show the data by making a line plot, where the horizontal scale is marked off in appropriate units-whole numbers, halves, or quarters.
Make a line plot to display a data set of measurements in fractions of a unit (1/2, 1/4, 1/8). Solve problems involving addition and subtraction of fractions by using information presented in line plots. For example, from a line plot find and interpret the difference in length between the longest and shortest specimens in an insect collection.
Make a line plot to display a data set of measurements in fractions of a unit (1/2, 1/4, 1/8). Use operations on fractions for this grade to solve problems involving information presented in line plots. For example, given different measurements of liquid in identical beakers, find the amount of liquid each beaker would contain if the total amount in all the beakers were redistributed equally.

Reviews

Questions & Answers