9 results
10th grade Common Core 3.MD.B.3 lessons
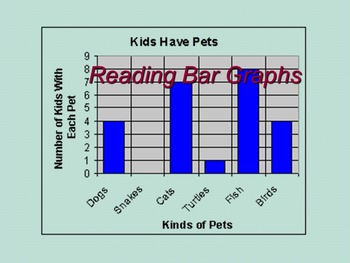
Reading a Bar Graph: meeting the Common Core.
Here is an activity to challenge your students into a higher thinking level from the traditional basics. “Reading a Bar Graph” will introduce your student into interpreting graphs using a step by step guide. “Reading a Bar Graph” will present the teacher with an option of introducing their students to interpret these graphs by applying a step by step a power point format or PDF format.
Use the step by step power point guide on a smart board, overhead projection system, or board & wo
Subjects:
Grades:
2nd - 12th, Adult Education
Types:
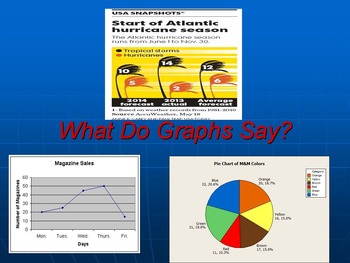
What Do Graphs Say?
This set of 20 activities will answer the question “What do graphs say?”. Challenge your students to analyze graphics and respond to given questions will improve their problem solving skills.
Teachers may use this packet as a cooperative group lesson, assigned homework, board work, after student completion of assignment activity, and many others.
Common core standards that will be met in this activity include CCSS. math content .3MD.B.3 and 3MD.B.4.
Presented in PDF or Power Point
Subjects:
Grades:
3rd - 12th, Adult Education
Types:
Google Sheets Bar Charts (Distance Learning)
Create bar charts using Google Sheets. Learn how to format the bar charts to represent information and trends. Create stacked and horizontal bar charts. Get a copy of the data in the lessons so you can follow along. Learn to publish charts using Docs, Slides, Sheets, or Sites.
Subjects:
Grades:
2nd - 12th, Higher Education, Adult Education, Staff
Types:
CCSS:
1.1 Model a story with a table representation
This product is meant to be versatile in format: Use it as a PowerPoint, Print select slides to create a worksheet for students, Use it to model students' interactive notebooks, etc. It's built to be flexible!For this lesson, students are to learn about multiple representations, hoping to master the table representation while introducing words, pictures, and graph representations as well. Students will practice visual modeling. This lesson is built to support Multi-Language Learners (MLL), Engli
Subjects:
Grades:
9th - 12th
CCSS:
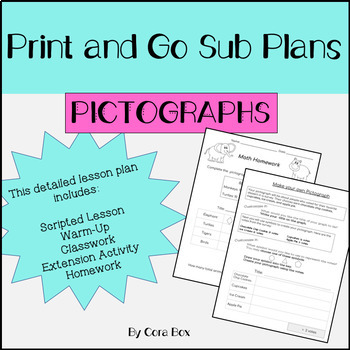
Pictograph Sub Plans- Print and Go!
Leave your sub with SCRIPTED lesson plans complete with a warm up, independent work, extension, and homework. This is everything a sub will need for one complete math lesson on pictographs. Students will be both creating and analyzing pictographs in this lesson. This resource requires zero prep and no additional manipulatives- a true print and go lesson!The pictographs in this lesson are scaled with each symbol in the pictograph representing either 2 or 5.
Subjects:
Grades:
2nd - 10th
Types:
Homework Habit Builder: Check In | Reflection | Math w. Sticky Note Graphs
Are your students studying at home? How frequently? Do you know? Do they? Use the power of the humble sticky note, and a few good questions to gather answers, reflect on progress and nudge all students towards more regular homework/independent studying. About: Gather quick and anonymous data about homework habitsUse social norming to encourage students to improve their homeworkReflect on progress and set goalsPractice math skills with personally relevant dataMath optional; adapt reflection to an
Subjects:
Grades:
8th - 12th, Higher Education, Adult Education
Also included in: Homework Habits Bundle: 4 Resources + Month by Month Plan
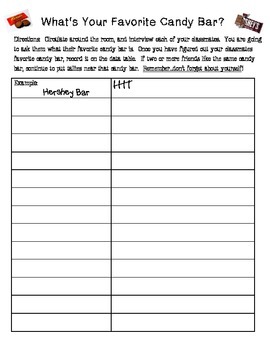
What's Your Favorite Candy Bar? - Engaging Activity & Recording Sheet (No Prep)
This is a fun and exciting way for students to graph their friends favorite candy bars. No preparation needed, just print and go!
Included:
Student recording sheet
Open graphs
Enlarged graph (optional)
Analyzing Data Sheet
Subjects:
Grades:
2nd - 12th
Types:
CCSS:
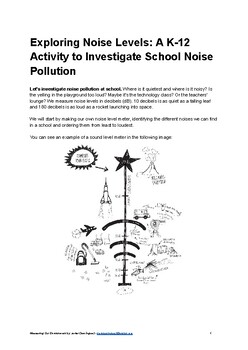
Exploring Noise Levels: A K-12 Activity to Investigate School Noise Pollution
In this engaging and educational activity, students will embark on a journey to explore and understand noise pollution within their school environment. The central question of this activity is, "How noisy is a school day?" Through this exploration, students will learn about noise levels, measured in decibels (dB), and gain awareness about the varying degrees of sound in different school settings.Objective:The main objective is to help students comprehend the concept of noise pollution and its p
Subjects:
Grades:
3rd - 12th
Science/Math - using Nearpod - GRAPHING INTRODUCTION LESSON 1
Are you looking for a tool that can freely supply a student with all the information needed to teach them with very little or no work from you? Well then this is the resource for you. This tool will prompt students with critical thinking exercises and challenges that address key ideas but supply the explanations as well. This teaching device can be provided to students in a full class forum or can be assigned as independent study. The following lesson is one of many to engage students in the ent
Grades:
3rd - 12th, Higher Education
Types:
CCSS:
Showing 1-9 of 9 results

