131 results
Common Core HSS-ID.A.1 lessons
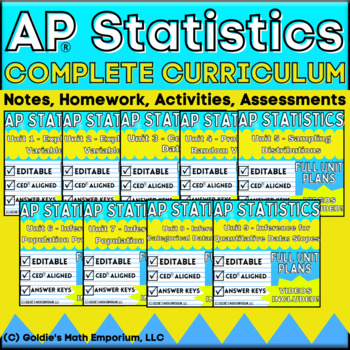
Goldie's FULL CURRICULUM for AP® Statistics
AP® Statistics Full CurriculumIn this product, you will receive all of Goldie's products related to AP® Statistics. All 9 units follow the College Board's© CED and include the following:Student Guided NotesStudent notes are "fill in the blank" style notes; teachers lead the lesson and work with students to complete the content. All content from the AP® CED is included and taught in the notes for this curriculum.Content VideosEach set of notes has a video to accompany it, where I teach the lesson
Subjects:
Grades:
10th - 12th
Types:
CCSS:
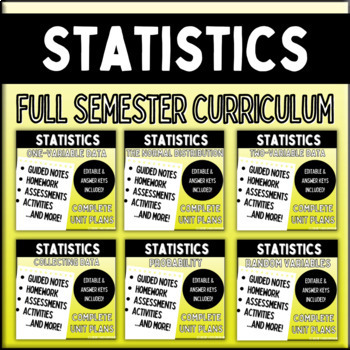
Statistics: FULL CURRICULUM BUNDLE
Statistics: Full Curriculum This is the FULL CURRICULUM bundle for my regular-level, Statistics course. If you are looking for my full curriculum for AP Statistics, follow the link here. This full curriculum is six units long and lasts 1 semester, approximately 90 school days. The following units are included in this bundle: Unit 1 – One-Variable DataUnit 2 – The Normal DistributionUnit 3 – Two-Variable DataUnit 4 – Collecting DataUnit 5 – ProbabilityUnit 6 – Random Variables Each unit contains
Subjects:
Grades:
11th - 12th
Types:
CCSS:
Goldie’s AP® Statistics UNIT 1 PLANS – Exploring One Variable Data
AP® Statistics Unit 1 – Exploring One Variable DataUnit BundleThis unit contains everything you need to teach "Exploring One Variable Data" in AP® Statistics or regular-level Statistics. Students will go through how to represent quantitative and categorical data with various graphs and tables; find and interpret various measures of center and spread; and calculate and compare positions and percentiles in a normal distribution. This unit is part of my larger unit bundle: Goldie's AP® Statistics F
Subjects:
Grades:
10th - 12th
Types:
CCSS:
Also included in: Goldie's FULL CURRICULUM for AP® Statistics
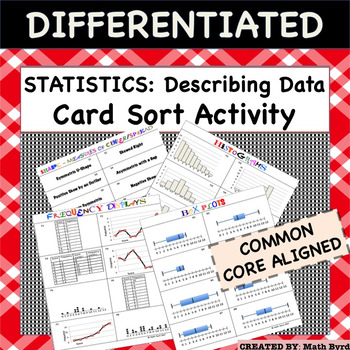
Statistics:Representing & Interpreting Data (Histogram, Box Plot, Dot Plot)
Complete Lesson! This lesson features a 40 CARD SORT, Differentiated Cornell Notes, Distribution Shapes Graphic Organizer, and Power Point to go with the notes! Perfect for the inclusive classroom! Within the Card Sort Activity there are 5 categories of cards to match: 1) Histogram2) Frequency Display (including Dot Plots, Frequency Line Graphs and Tables)3) Box Plots4) Describing Shape5) Describing Measures of Center & Spread. With 8 different sets of matches, there are 40 cards total. Stud
Subjects:
Grades:
8th - 12th
Types:
CCSS:
Also included in: Common Core Algebra 1 CARD SORT ACTIVITIES - BUNDLE PRICE!
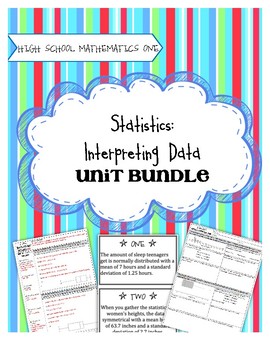
High School Math 1: Statistics and Interpreting Data
Task-Based Learning gets students intrinsically motivated to learn math! No longer do you need to do a song and dance to get kids interested and excited about learning. The tasks included in this unit, followed by solidifying notes and practice activities, will guarantee that students understand the concepts. This unit covers:
- Displaying one-variable data in a histogram, dot plot, or box plot
- Describing the distribution of data using statistical vocabulary
- Using data models and stati
Subjects:
Grades:
8th - 10th
Types:
CCSS:
High School Data Analysis Project
This project covers a large range of data analysis methods. There are eleven total parts to the project.
Part One: the students have to collect data from 20 students outside of the classroom. Directions specify to ask students from each grade level.
Part Two: Measures of Center and Variation. Students will calculate mean, median, mode, range, and standard deviation for some of the data collected. Definitions of each term are included.
Part Three: Box-And-Whisker Plot. Students will create t
Subjects:
Grades:
9th - 12th
Types:
CCSS:
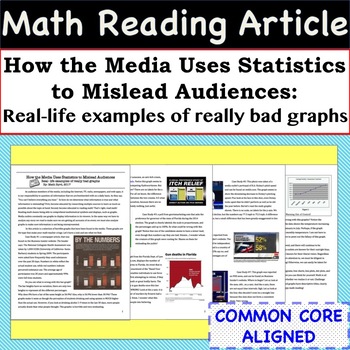
Statistics Math Article - Case Studies of Bad Graphs found in the Media
Incorporate Reading & Writing into the Math Classroom with this article and accompanying worksheet! The 4 page article is entitled - "How the Media Uses Statistics to Mislead Audiences: Real- life examples of really bad graphs". The worksheet helps students summarize the case studies and the article as a whole. This resource can be used in so many ways, some ideas are: station activity, independent reading assignment, small group activity, homework assignment, or whole class discussion.Skill
Subjects:
Grades:
8th - 11th
CCSS:
Also included in: Common Core Algebra 1 MATH READING ARTICLES - BUNDLE PRICE!
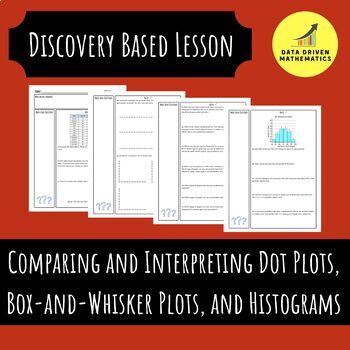
Comparing and Interpreting Dot Plots, Box-and-Whisker Plots, and Histograms
About This Resource:A four page packet containing an investigation into comparing and interpreting dot plots, box-and-whisker plots, and histograms. In addition, you will receive the answer key to help with the implementation of this activity in your classroom. The worksheet flows perfectly and could be used in more of a discovery format or a instructor guided notes.What's Included:You will receive a zipped folder. Inside the zipped folder is a worksheet and the answer key in PDF format.Similar
Subjects:
Grades:
6th - 10th
CCSS:
High School Math 1: ENTIRE YEAR BUNDLE!
This is a $144 dollar value!
This bundle includes absolutely everything you need to teach the entire High School Math 1 year-long 9th grade course. There are 10 full units included in this bundle purchase, including all developing tasks, solidifying notes, practice activities, and assessments. These are the units included in this purchase:
Unit 1: Geometry and Rigid Transformations
Unit 2: Statistics and Interpreting Data
Unit 3: Expressions and Equations
Unit 4: Compound Inequalities and Abso
Subjects:
Grades:
8th - 10th
Types:
CCSS:
Statistics: One Variable Data
StatisticsUnit 1: One Variable Data A complete unit bundle for a high school statistics course. Welcome! This is the complete unit plan for the first unit in my regular level Statistics class. (If you are interested in the AP Statistics Unit 1 Plans, check out my listing here.) Included in this resource: 9 complete sets of student guided notes (annotated answer keys included)9 homework problem sets + complete test review (annotated answer keys included)3 assessments – 2 quizzes and test (answer
Subjects:
Grades:
10th - 12th
Types:
CCSS:
Also included in: Statistics: FULL CURRICULUM BUNDLE
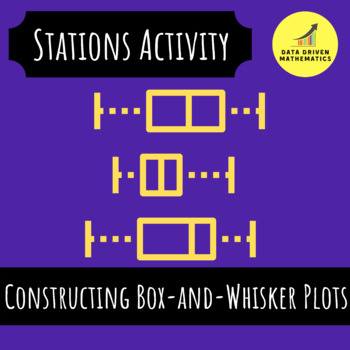
Constructing Box-and-Whisker Plots - Stations Activity
About This Resource:In this activity students will practice constructing box-and-whisker plots when provided a data set. Students will need to calculate the five number summary (minimum, first quartile, median, third quartile, and maximum) in order to be successful on this activity. The prep required by the teacher consists of printing the stations cards, making a copy of the graphic organizer for each student, and setting the expectations and instructions with their students.Your students will
Subjects:
Grades:
6th - 12th
Types:
CCSS:
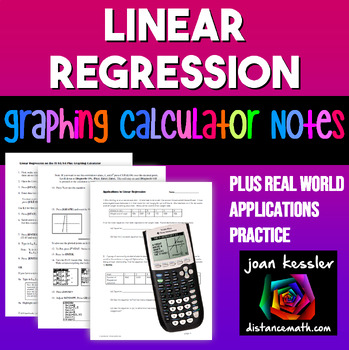
Linear Regression | TI-84 Graphing Calculator plus Applications
This clear, concise, step by step notes help your students use the TI 83 and TI 84 Graphing Calculator to enter data into lists, create a linear regression equation and to plot the equation along with the data simultaneously. Also included is a 3 page worksheet with five real world examples for students to practice. Solutions included. These can be used as Binder Notes or printed smaller for Interactive Notebooks._________________________________________________Related Products★ Quadratic Re
Subjects:
Grades:
9th - 11th, Higher Education
Types:
CCSS:
Also included in: Linear Functions and Systems Algebra 2 Unit 2 Activity Bundle
Goldie’s Guided Note Bundle for AP® Statistics
AP® StatisticsGuided Note BundleNote: If you have purchased individual Unit Plans or Goldie's FULL CURRICULUM for AP® Statistics, you already have these resources. You do NOT need to purchase this.Welcome! This is a bundle for all of my guided notes for all Units of AP Statistics. All of the resources are 100% editable, to modify to fit your classroom needs. The zip folder includes the Word document, which you have permission to edit completely. The PDF version and answer keys are included for y
Subjects:
Grades:
10th - 12th
Types:
CCSS:
Data and Statistics - Editable Algebra 1 Binder Notes
This bundle includes editable binder notes and practice on 5 algebra 1 skills related to data and statistics. These notes provide the teacher and students with an organized set of guided notes and in class practice. Each topic includes 2 pages (1 page double-sided) of notes and examples. The following topics are included:Representing Univariate Numerical Data (using Line Plots, Histograms, and Box Plots)Representing Univariate Categorical Data (using Line Plots, Circle Graphs, and Bar Graphs)
Grades:
7th - 9th
CCSS:
Algebra 1 Notes and Worksheets Full Year Differentiated Guided Notes
Enhance learning with these Algebra 1 Notes and Worksheets. This full-year set includes differentiated guided notes and worksheets, making algebra accessible for all students. Designed for diverse learning needs, it makes algebra accessible and engaging.Spend less time prepping and more time teaching effectively with this comprehensive resource.This Full Year Bundle includes 75 sets of notes and worksheets!Each set includes 3 versions of notes (Guided Notes, Blank Graphic Organizer & Filled
Grades:
9th - 10th
CCSS:
Algebra 1 Curriculum Full Year Differentiated Lessons Activities Assessments
Unlock student potential with our Algebra 1 Curriculum, differentiated for struggling learners. This full year program provides the support needed for success, making algebra manageable and accessible for every learner.Empower your students to succeed in algebra with a curriculum designed to meet their unique needs all year long.*This curriculum was designed to support students on or below grade level in Algebra 1 that have struggled in math. It includes many built-in differentiation options (do
Grades:
9th - 10th
CCSS:
Algebra 1 Curriculum Full Year Differentiated Lessons
Unlock student potential with our Algebra 1 Curriculum, differentiated for struggling learners. This full-year program provides the support needed for success, making algebra manageable and accessible for every learner.Empower your students to succeed in algebra with lessons designed to meet their unique needs all year long.*This curriculum was designed to support students on or below grade level in Algebra 1 that have struggled in math. It includes many built-in differentiation options (downloa
Grades:
9th - 10th
CCSS:
Common Core Math 1: Statistics Unit-5 Days of Lesson Plans!!
This unit bundle is 25% less than buying these products individually! It contains 3 teaching lessons, a test review, and test. Answer keys included for everything.
Day 1: Guided notes and worksheet on Mean, Median, and Mode and Box and Whisker Plots.
Day 2: Guided notes, activity, and worksheet on standard deviation and the effects of outliers on the mean, standard deviation, range, and interquartile range.
Day 3: Guided notes, activity, and worksheet on dot plots, histograms, tables, an
Subjects:
Grades:
8th - 11th
Types:
CCSS:
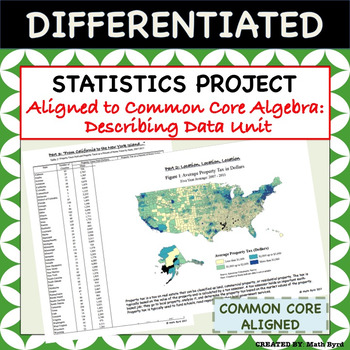
Statistics Project - Aligned to Common Core Algebra - Describing Data Unit
This differentiated U.S. Home Energy & Tax Themed Statistics Project covers all of the "describing data" standards of the Common Core Algebra Course using real data! Students will analyze various forms of tables & graphics to make inferences and interpret the data. The project is perfect for use as a summative assessment since students are required to justify their findings in open-ended format. Allow students to work in pairs, small groups, or individually! A grading rubric and selected
Subjects:
Grades:
8th - 11th
Types:
CCSS:
Also included in: Common Core Algebra 1 PROJECTS - BUNDLE PRICE!
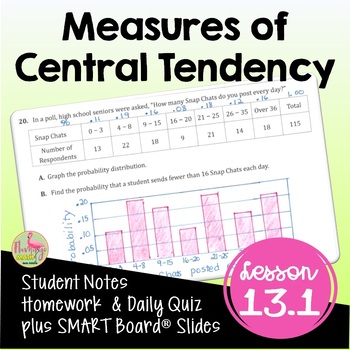
Measures of Central Tendency (Algebra 2 - Unit 13)
Measures of Central Tendency Algebra 2 Lesson:Your Pre-AP Algebra 2 Honors students will draw, analyze and interpret box-and-whisker plots, find outliers, and calculate measures of central tendency in this unit 13 lesson on Data Analysis & Statistics that cover the concepts in depth. #distancelearningtptWhat is included in this resource?⭐ Guided Student Notes⭐ Google Slides®⭐ Fully-editable SMART Board® Slides⭐ Homework/Practice assignment⭐ Lesson Warm-Up (or exit ticket)⭐Daily Content Quiz
Subjects:
Grades:
8th - 11th, Higher Education
CCSS:
Also included in: Algebra 2 Curriculum Mega Bundle | Flamingo Math

Gr 9 Math Full Course Lessons, Assignments, Tests, and Answer Keys
Comprehensive Grade 9 Math Curriculum ResourcesWelcome to your one-stop destination for Grade 9 Math teaching materials, designed to align with the Manitoba curriculum standards. These resources encompass a full range of teaching and learning materials, crafted to support diverse learning paths within the Grade 9 classroom.What's Inside:Detailed Lesson Plans: Each lesson plan is structured to provide clarity and ease of use, ensuring that educators can seamlessly integrate these resources into
Subjects:
Grades:
9th, Adult Education
CCSS:
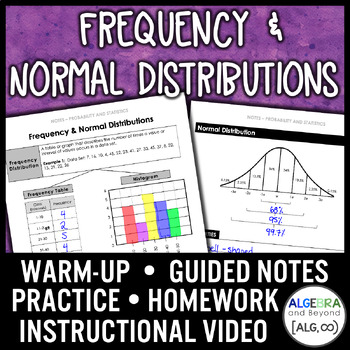
Frequency and Normal Distribution Lesson | Video | Guided Notes | Homework
Build student engagement and participation as you teach statistics. This Frequency and Normal Distribution Lesson covers frequency tables, histograms, and normal distribution (empirical rule) in a creative, comprehensive, and clear way. Scaffolding is embedded right into the guided notes that students complete while you teach. Students remain motivated to practice key statistics skills, and you have an easy way to teach frequency and normal distribution from start to finish.INCLUDES:Link to Vide
Subjects:
Grades:
10th - 12th
CCSS:
Statistics: Sampling Distributions
StatisticsUnit 7: Sampling DistributionsThis complete unit bundle teaches students all about the normal probability distribution, the sampling distribution for a sample proportion, the Central Limit Theorem, and the sampling distribution for a sample mean.Included in this resource:3 complete sets of student guided notesPowerPoint presentations of all the notes for easy and seamless class instruction5 homework problem sets + complete test review2 assessments – quiz and testAn in-class review less
Subjects:
Grades:
11th - 12th
Types:
CCSS:
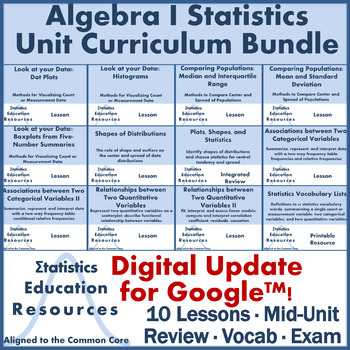
Bundle: Algebra 1 Statistics Unit Curriculum (Common Core)
UPDATE: Now includes lesson slides and editable worksheets for Google™ Slides and unit exam in Google™ Forms!Algebra I Statistics Unit BundleThis product is a bundle that includes 10 Common Core Aligned lessons, 4 statistics vocabulary lists (1 master list for the whole unit, and 3 smaller unit “sub lists”), 1 mid-unit integrated mini-review and worksheet (as homework or a quiz!), and 1 exam with answer key. Each lesson includes lecture slides with speaker notes, a handout, worksheet with answer
Subjects:
Grades:
8th - 11th
Types:
CCSS:
Showing 1-24 of 131 results

