64 results
5th grade statistics lectures for Microsoft OneDrive
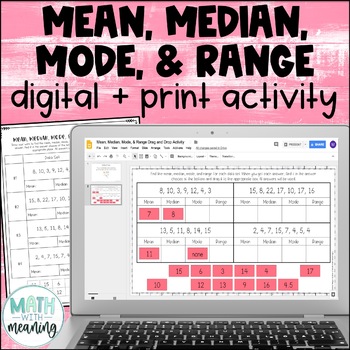
Mean, Median, Mode, & Range Digital and Print Activity for Google Drive
Looking for a fun, no-prep activity for finding mean, median, mode, and range? Students will find the mean, median, mode, and range for 4 data sets. They will then then find their answer from the answer choices at the bottom and drag it to the appropriate spot. Each data set contains 6-8 numbers. Please view the preview file to make sure that this activity is appropriate for your students.This product includes the following:A link to the digital activity on Google Slides including student direct
Subjects:
Grades:
5th - 8th
CCSS:
Also included in: Middle School Math Digital and Print Activity Bundle Volume 1
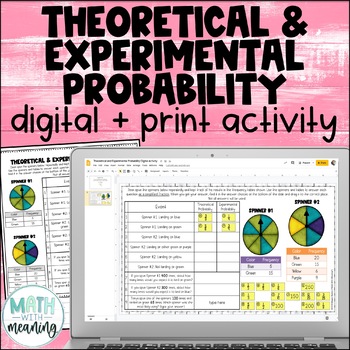
Theoretical and Experimental Probability Digital and Print Activity
Looking for an engaging, no-prep activity to practice working with theoretical and experimental probability? Students will use two sets of spinners and frequency tables to answer questions in this fun digital and print activity.This activity requires students to find the theoretical and experimental probabilities of simple events and to use theoretical probabilities to make predictions. Please view the preview file to make sure that this activity is appropriate for your students.This product inc
Subjects:
Grades:
5th - 8th
CCSS:
Also included in: Middle School Math Digital and Print Activity Bundle Volume 3
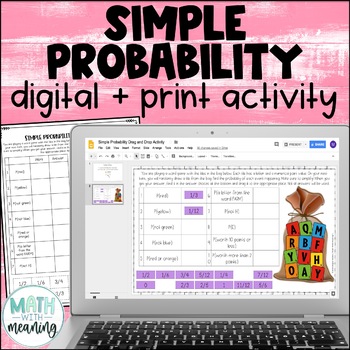
Simple Probability Digital and Print Drag and Drop Activity for Google
Looking for an engaging, no-prep activity to practice finding the probability of simple events? Students will use the included image to find the probability of 10 simple events. They will then find their answer from the answer choices at the bottom and drag it to the appropriate spot. Please view the preview file to make sure that this activity is appropriate for your students.This product includes the following:A link to the digital activity on Google Slides including student directionsA PowerP
Subjects:
Grades:
5th - 8th
CCSS:
Also included in: Middle School Math Digital and Print Activity Bundle Volume 1
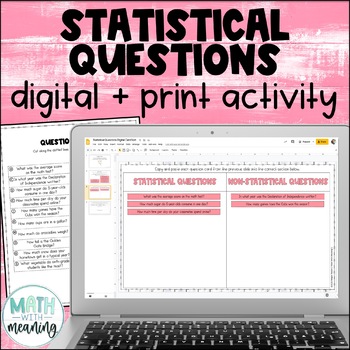
Statistical Questions Digital and Print Card Sort for Google Drive and OneDrive
Looking for an engaging, no-prep activity to practice identifying statistical and non-statistical questions? Students will read 20 questions and determine if they are statistical or non-statistical questions in this fun digital and print card sort activity. They will also choose a topic and write one one of each type of question of their own about that topic.Please view the preview file to make sure that this activity is appropriate for your students.This product includes the following:A link to
Subjects:
Grades:
5th - 8th
CCSS:
Also included in: Middle School Math Digital and Print Activity Bundle Volume 3
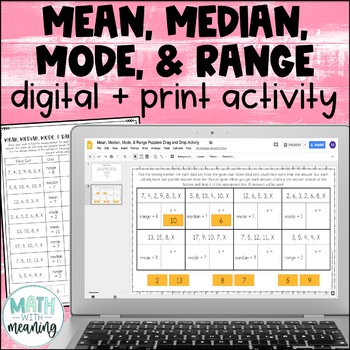
Mean, Median, Mode, & Range Missing Numbers Digital and Print Activity
Looking for a fun, no-prep activity for calculating mean, median, mode, and range? Students will find the missing number in a data set given either the mean, median, mode, or range. They will then then find their answer from the answer choices at the bottom and drag it to the appropriate spot. Each data set contains 4-7 numbers. Some data sets have more than one possible answer, but only one possible answer choice will be given. Please view the preview file to make sure that this activity is app
Subjects:
Grades:
5th - 8th
CCSS:
Also included in: Middle School Math Digital and Print Activity Bundle Volume 1
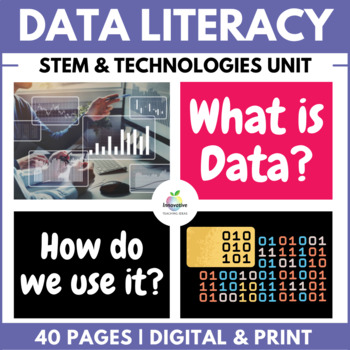
Data Literacy in STEM & Digital Technologies | Numerical, Categorical & Digital
Enhance your student's understanding of DATA LITERACY and DIGITAL LITERACY What is Data? Why it's important? How do numerical, categorical, and digital data fit within STEM and DIGITAL TECHNOLOGIES?Well, look no further... This bundle contains everything you need to teach the essentials of DATA LITERACY with absolutely NO PREP REQUIRED.CoveringNumerical DataCategorical DataDigital DataData collectionData analysisData Sorting and FilteringData visualization and representationBinary, QR and more
Grades:
3rd - 10th, Adult Education, Staff
Types:
Statistics Unit
Fun with Box and Whiskers, Mean, Median, Mode, Range, Five Number Summary using anything from McDonald's food to M&M's with SKittles.
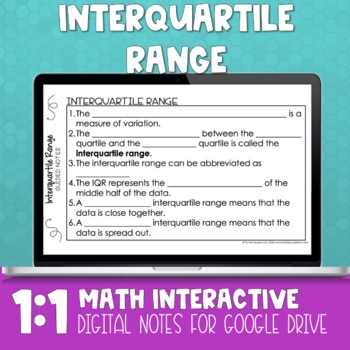
Interquartile Range Digital Math Notes
Interquartile Range (IQR) 1:1 Interactive Math NotebookAre you looking for a way to engage your math students in a 1:1 device environment? Check out my line of 1:1 Interactive Math Notebooks! Included in this product: -Interquartile Range Guided Notes-Interquartile Range Practice Page-Interquartile Range Frayer Models for Vocabulary Practice-2 different warm-ups -2 different exit slips -Answer Keys*Please note that the download includes a link to the product and a tutorial for teacher use. This
Subjects:
Grades:
5th - 8th
Types:
CCSS:
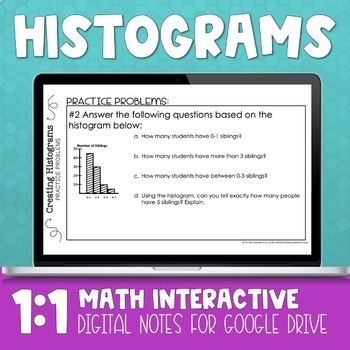
Histogram Digital Math Notes
Histogram 1:1 Interactive Math NotebookAre you looking for a way to engage your math students in a 1:1 device environment? Check out my line of 1:1 Interactive Math Notebooks! Included in this product: -Histogram Guided Notes-Histogram Practice Page-Histogram Frayer Models for Vocabulary Practice-2 different warm-ups -2 different exit slips -Answer Keys*Please note that the download includes a link to the product and a tutorial for teacher use. This product is best used in Google Drive or Micros
Subjects:
Grades:
5th - 8th
Types:
CCSS:
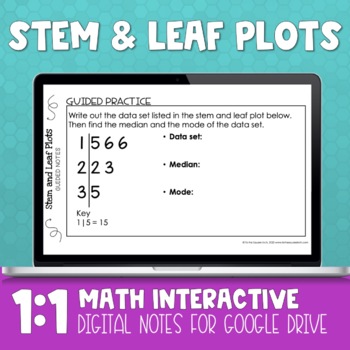
Stem and Leaf Plot Digital Math Notes
Stem and Leaf Plot 1:1 Interactive Math NotebookAre you looking for a way to engage your math students in a 1:1 device environment? Check out my line of 1:1 Interactive Math Notebooks! Included in this product: -Stem and Leaf Plot Guided Notes-Stem and Leaf Plot Practice Page-Stem and Leaf Plot Frayer Models for Vocabulary Practice-2 different warm-ups -2 different exit slips -Answer Keys*Please note that the download includes a link to the product and a tutorial for teacher use. This product is
Subjects:
Grades:
5th - 8th
Types:
CCSS:
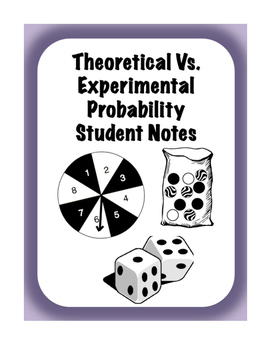
Theoretical vs Experimental Probability Interactive Scaffolded/Guided Notes
These notes provide a clear explanation of theoretical and experimental probability with examples involving spinners, die, and marbles. Students will also get extra practice converting their probabilities to decimals, fractions, and percents along with predicting the probability of an event happening.
There is also a flipped classroom video that goes along with these notes that can be accessed at-
https://youtu.be/FAHvmiYJA1A
Subjects:
Grades:
5th - 8th
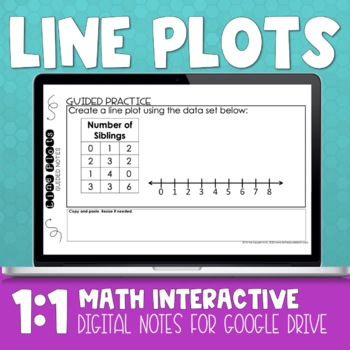
Line Plot Digital Math Notes
Line Plot 1:1 Interactive Math NotebookAre you looking for a way to engage your math students in a 1:1 device environment? Check out my line of 1:1 Interactive Math Notebooks! Included in this product: -Line Plot Guided Notes-Line Plot Practice Page-Line Plot Frayer Models for Vocabulary Practice-2 different warm-ups -2 different exit slips -Answer Keys*Please note that the download includes a link to the product and a tutorial for teacher use. This product is best used in Google Drive or Micros
Subjects:
Grades:
5th - 8th
Types:
CCSS:
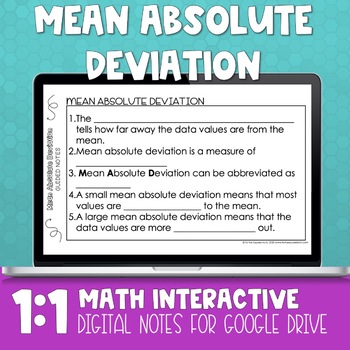
Mean Absolute Deviation Digital Notes
Mean Absolute Deviation (MAD) 1:1 Interactive Math NotebookAre you looking for a way to engage your math students in a 1:1 device environment? Check out my line of 1:1 Interactive Math Notebooks! Included in this product: -Mean Absolute Deviation Guided Notes-Mean Absolute Deviation Practice Page-Mean Absolute Deviation Frayer Models for Vocabulary Practice-2 different warm-ups -2 different exit slips -Worked out Answer keys*Please note that the download includes a link to the product and a tuto
Subjects:
Grades:
5th - 8th
Types:
CCSS:
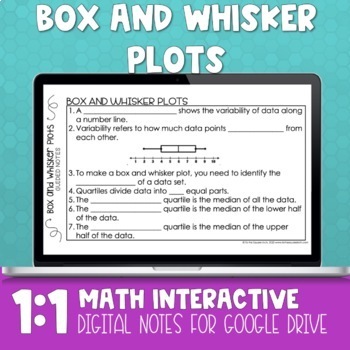
Box Plot Digital Math Notes
Box and Whisker Plots 1:1 Interactive Math Notebook6.SP.B.4Are you looking for a way to engage your math students in a 1:1 device environment? Check out my line of 1:1 Interactive Math Notebooks! Included in this product: -Box and Whisker Plots Guided Notes-Box and Whisker Plots Practice Page-Box and Whisker Plots Frayer Models for Vocabulary Practice-2 different warm-ups -2 different exit slips -Answer Keys*Please note that the download includes a link to the product and a tutorial for teacher
Subjects:
Grades:
5th - 8th
Types:
CCSS:
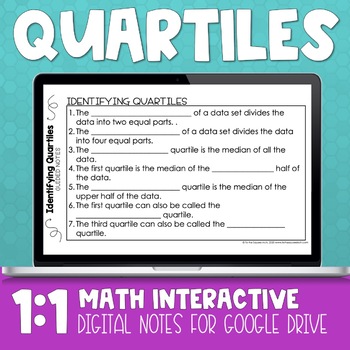
Quartile Digital Math Notes
Quartiles 1:1 Interactive Math NotebookAre you looking for a way to engage your math students in a 1:1 device environment? Check out my line of 1:1 Interactive Math Notebooks! Included in this product: -Quartiles Guided Notes-Quartiles Practice Page-Quartiles Frayer Models for Vocabulary Practice-2 different warm-ups -2 different exit slips -Answer Keys*Please note that the download includes a link to the product and a tutorial for teacher use. This product is best used in Google Drive or Micros
Subjects:
Grades:
5th - 8th
Types:
CCSS:
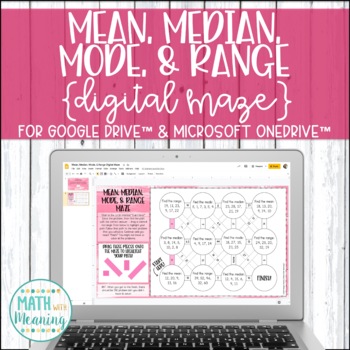
Mean, Median, Mode, and Range DIGITAL Maze Activity Distance Learning
Students will practice solving problems involving mean, median, mode, and range with this fun digital maze activity! Students will end up solving a total of 10 problems.Each data set includes 4-7 numbers. The answer to each problem is a whole number. There is a problem where there is no mode. Please view the preview file to make sure that these types of problems are appropriate for your students.This product includes the following:A link to the activity on Google Slides including student directi
Subjects:
Grades:
5th - 8th
CCSS:
Also included in: Middle School Math DIGITAL Maze Activity Bundle for Google & OneDrive

Changing the Face of Math Education Book 2
Whether you are a teacher, a parent, a student, strong in math or weak in math, the material in this book will change the way you view and compute math in the future. Be ready to be amazed and intrigued as you go through the book by all the information you probably were never exposed to in your math education. This book will answer many questions you may have had in the past while giving you a much stronger conceptual understanding of math. This book will expose you to many different problem-sol
Subjects:
Grades:
4th - 12th
Types:
Statistics (Mean, Median, Mode, Box and Whiskers, with the five number summary
Teaching statistics to 6th graders can be an engaging experience by making the concepts relatable and visual. Five-Number SummaryThe five-number summary includes the minimum, first quartile, median, third quartile, and maximum. These values help summarize a set of data and are used in creating box plots. Start by having students collect a small dataset, such as their test scores, and calculate these five points to see how data is distributed.Box and Whisker PlotsA box and whisker plot (box plot)
Subjects:
Grades:
5th - 7th
Types:
Also included in: Statistics Unit
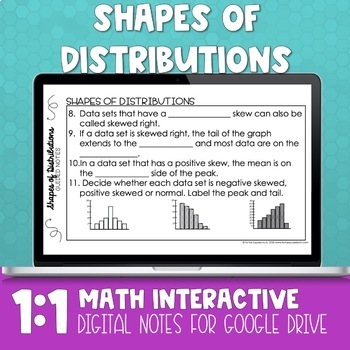
Shapes of Distributions Digital Math Notes
Shapes of Distributions 1:1 Interactive Math Notebook6.SP.A.2Are you looking for a way to engage your math students in a 1:1 device environment? Check out my line of 1:1 Interactive Math Notebooks! Included in this product: -Shapes of Distributions Guided Notes-Shapes of Distributions Practice Page-Shapes of Distributions Frayer Models for Vocabulary Practice-2 different warm-ups -2 different exit slips -Answer Keys*Please note that the download includes a link to the product and a tutorial for
Subjects:
Grades:
5th - 8th
Types:
CCSS:
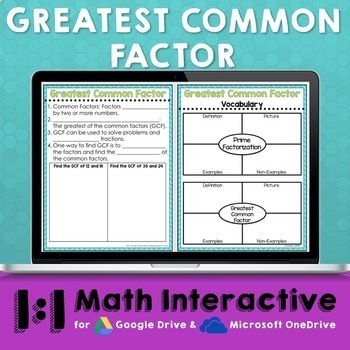
GCF Digital Math Notes
GCF Greatest Common Factor 1:1 Interactive Math NotebookAre you looking for a way to engage your math students in a 1:1 device environment? Check out my line of 1:1 Interactive Math Notebooks! Included in this product: -GCF Guided Notes-GCF Practice Page-GCF Frayer Models for Vocabulary Practice-2 different warm-ups -2 different exit slips -Answer Keys*Please note that the download includes a link to the product and a tutorial for teacher use. This product is best used in Google Drive or Microso
Subjects:
Grades:
5th - 8th
Types:
CCSS:
Also included in: 6th Grade Math Digital Notes - Set 1

Data Representation Powerpoint
The presentation contains: 1) TALLY MARKS Learning Objectives. Definition of a tally mark. Uses of tally mark. How to count a tally mark. Tally Mark Chart. Construction of a tally mark table with an example. Application on real life problems on tally mark. Read and Interpret a tally mark table.The presentation contains: 2) FREQUENCY DISTRIBUTION TABLEDefinition of a Frequency Distribution Table. Types of Frequency Distribution Table: a) Discrete Frequency Distribution Table (Ungrouped).b) C
Subjects:
Grades:
1st - 10th, Higher Education, Staff
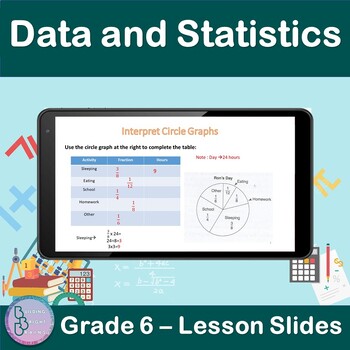
Data and Statistics | 6th Grade PowerPoint Lesson Slides | Circle Graphs
Are you teaching your students about Data and Statistics For 6th Grade? Plenty of examples and application exercises are included. You can also easily convert this to a Google Slides lesson by dragging it into your Google Drive.What is included?✦ 9 total slides for notes, examples and applications.✦ All steps are animated to allow the teacher to explain them gradually. At the end of the lesson, students will be able to✦ Interpret Circle Graphs.✦ Use a circle graph to complete s table.✦ Use a cir
Subjects:
Grades:
5th - 7th
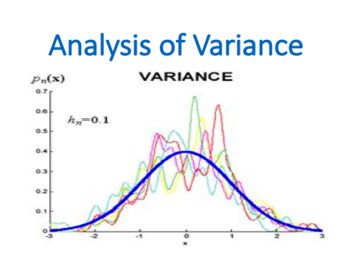
Analysis of Variance (ANOVA) (Statistics)
Analysis of Variance (ANOVA) is a lecture which is covered within the Statistic or Basic Business Statistic module by business and economics students.Analysis of variance, known by the acronym ANOVA, allows statistical comparison among samples taken from many populations. While ANOVA literally does analyze variation, the purpose of ANOVA is to reach conclusions about possible differences among the means of each group, analogous to the hypothesis tests of the previous chapter. Every ANOVA design
Subjects:
Grades:
5th - 12th, Higher Education, Adult Education, Staff
Types:
Also included in: Statistics Module Bundle
A Roadmap for Analyzing Data (Statistics)
A Roadmap for Analyzing Data is a lecture which is covered within the Statistic or Basic Business Statistic module by business and economics students. Choosing appropriate statistical methods for your data is the single most important task you face and is at the heart of “doing statistics.” But this selection process is also the single most difficult thing you do when applying statistics! How, then, can you ensure that you have made an appropriate choice? By asking a series of questions, you can
Subjects:
Grades:
5th - 12th, Higher Education, Adult Education, Staff
Also included in: Statistics Module Bundle
Showing 1-24 of 64 results


