27 results
Statistics reflective journals for teachers for staff and administrators
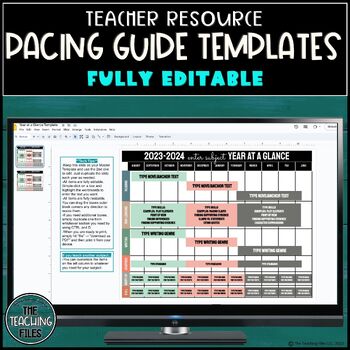
Pacing Guide and Year At A Glance Editable Templates Full Year
These Pacing Guide and Year At A Glance Editable Templates are core to mapping out your school year. Each template is fully editable and customizable for any subject. About This Product:-Google format-2 templates:Daily/Weekly Pacing Guide Year At A Glance -Fully editable-The daily/weekly pacing guide is dated for you from August 2023-July 2024, however, you can adapt dates if needed. -When you download the product, it will AUTOMATICALLY make a copy for you in your Google Drive. All you must do i
Subjects:
Grades:
Not Grade Specific
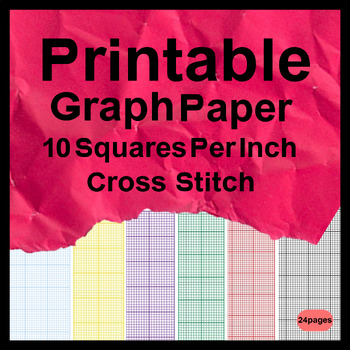
Printable Graph Paper 10 Squares Per Inch Cross Stitch
Printable Graph Paper 10 Squares Per Inch Cross Stitch - Grid paper is essentially the type of paper most commonly used for drawing and sketching purposes. It is widely used for making plan charts, designing websites, developing home ideas and so forth. A great deal of businesses who need to produce a company card, business brochures, catalogues, brochures, and so forth need this kind of graph paper.
Subjects:
Grades:
5th - 12th
6th Grade Math CCSS Statistics & Data Displays Test Prep Review Assessment
This 6th Grade Math digital, auto-grading, no prep, formative assessment and test prep review is on Data Displays, Data Analysis and Statistics (and Probability). It is a check for understanding on the 6th Grade Common Core Standards: statistical questions, describing data distributions using center, spread (range) and overall shape, working with line plots, dot plots, histograms, box and whisker plots, finding the mean, median, measuring variability using IQR interquartile range and/or MAD mean
Subjects:
Grades:
6th
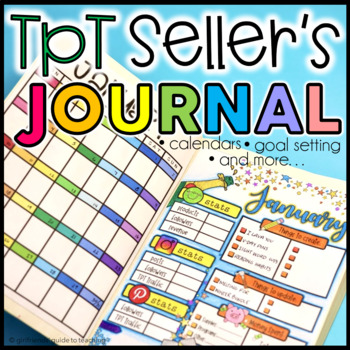
TpT Seller's Journal I Calendars and Monthly Planning
This monthly planner or BULLET JOURNAL is intended to help TpT sellers or ANY SELLER by recording and tracking stats and helping them organize and set goals for each month of the year! This file has a bullet journal style format with fun illustrations and designs for each month of the year. This file also comes with editable pages to create the journal page that best fits your needs.NOTE: There is a PREVIEW available for this file. Please, take a look and see if this activity is a good fit for y
Subjects:
Grades:
Not Grade Specific
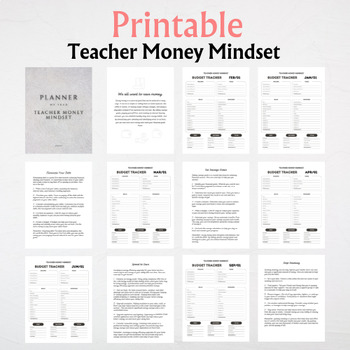
Teacher Money Mindset - Monthly Budget Tracker - 10 Best Ways to Save Money
Keep track of income & save for tomorrow with 12 month tracking sheets, and 10 Best Ways to Save Money with TEACHER MONEY MINDSET PRINTABLEIt's great to hear that there is a resource available to help teachers keep track of their income and expenses. Managing money can be challenging, and having a budget template can be a useful tool to help individuals stay organized and plan for the future. It's important for everyone, including teachers, to prioritize saving and planning for their financi
Subjects:
Grades:
Not Grade Specific
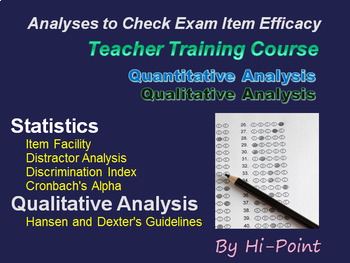
Teacher Training Course: Analyses to Check Exam Item (Question) Efficacy
This is a PowerPoint teacher training course to show your teaching staff how to analyze the questions (items) in the exams they have created. They will analyze the tests already completed by students and graded by teachers to see if their examination items were well written, effective at measuring what they set out to measure and to flag up questions that should be reviewed or even removed from future tests.The analyses are in two parts:Statistical analysis (Quantitative)Item Facility and Distra
Grades:
Staff
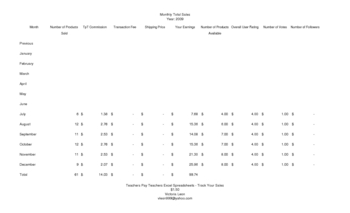
Teachers Pay Teachers Excel Spreadsheets - Track Your Sales
PC users may track their TpT sales using the following 18 Excel spreadsheets:
Track your Number of Products Sold, TpT Commission, Transaction Fee, Shipping Price,
Your Earnings, Number of Products Available, Overall User Rating, Number of
Votes, and Number of Followers using a Daily Total Sales, Weekly Total Sales,
Monthly Total Sales, Quarterly Total Sales, or Yearly Total Sales spreadsheet.
Track the sales of each of your products using a Daily Product Sales, Weekly
Product Sales, Monthl
Subjects:
Grades:
Not Grade Specific
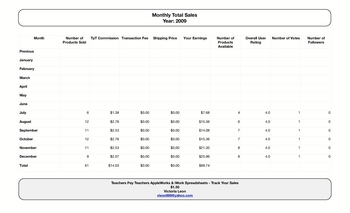
Teachers Pay Teachers iWork Spreadsheets - Track Your Sales
MAC users may track their sales using AppleWorks or iWork.
There are 18 spreadsheets for each computer program.
Track your Number of Products Sold, TpT Commission, Transaction Fee, Shipping Price, Your Earnings, Number of Products Available, Overall User Rating, Number of Votes, and Number of Followers using a Daily Total Sales, Weekly Total Sales, Monthly Total Sales, Quarterly Total Sales, or Yearly Total Sales spreadsheet.
Track the sales of each of your products using a Daily Product Sa
Subjects:
Grades:
Not Grade Specific
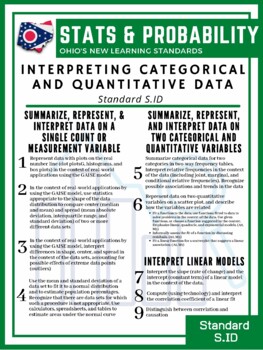
Ohio's Statistics & Probability Standards - Poster Edition
Ohio's STATISTICS & PROBABILITY StandardsThis set of 4 Posters covering all 31 standards can be downloaded and printed into any size paper you wish. The default is 18"x24" for easy viewing on your classroom walls. Want to make the Statistics & Probability Standards come alive in a visually appealing manner -- Get these today!Whether for your wall or to make a booklet for your students, these are a great way to keep the standards in front of your students.
Subjects:
Grades:
9th - 12th

After School Attendance Workbook
This Excel workbook tracks student attendance in an after school program. Each student's days automatically tabulate on the End-of-Year Total Days page. Great spreadsheet to use when reporting to grant authorities or school administrators. Totals are computed by the month, day and year.Includes monthly interactive attendance sheets that can easily be managed by student/parent after school volunteers.
Grades:
Not Grade Specific
Data Displays
Students display data by constructing dot plots, histograms, and box plots. We will describe and analyze the overall shape of the data. This item includes:1 page of planning information7 pages of student worksheets 1 reproducibleAnswer KeysThis lesson should take 2 periods.Thank you for taking the time to shop at my store. I hope you found what you needed to provide engaging and meaning lessons and activities for your students.Please click here to follow our store for updates. Did you know you c
Subjects:
Grades:
6th
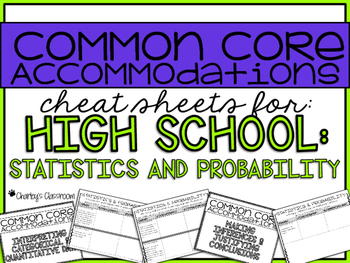
Common Core *Cheat Sheets* {High School Statistics & Probability}
This no fuss or frills "cheat sheet" allows you to keep notes on how you adapted/modified lessons you've taught. Perfect for keeping track of adapted assignments. - i.e. homework, tests, projects, etc.
Included in this product is a PDF file listing all standards, with plenty of space allowing you to write notes on the lesson/assignment, and any adaptations that were made. This is the perfect "cheat sheet" to use year after year!
If you have any questions do not hesitate to ask!
Email: charle
Subjects:
Grades:
9th - 12th
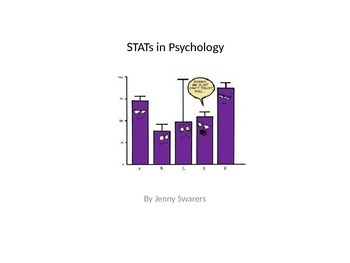
basic statistics in psychology
Powerpoint to help prepare educators in understanding the basic terms behind psychological evaluations used in special education.
Subjects:
Grades:
9th - 12th, Higher Education, Adult Education

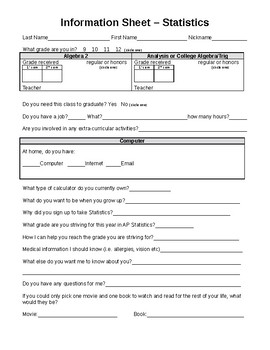
Information Sheet - Statistics
To be used at the beginning of the year to get to know your students better.
Subjects:
Grades:
9th - 12th

attention Subs may not leave campus early
Sub announcement for sub folders. Highly recommend printing on colored paper.
Subjects:
Grades:
Not Grade Specific
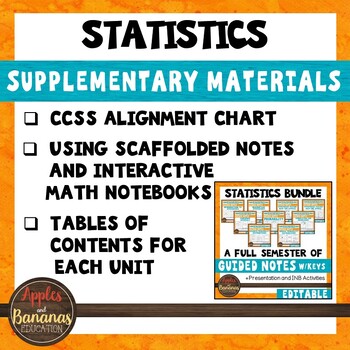
Statistics Bundle Supplementary Materials and CCSS Alignment Guide
This product contains three components: a CCSS Alignment Guide (to determine which standards are addressed in each unit of our Statistics Bundle), a "How to Use" guide, and a detailed Table of Contents for each unit in our Statistics Interactive Notebook Bundle.These supplementary materials can help you determine if the Statistics Bundle is a good purchase for you. If you have already purchased our materials, these products will provide additional organization tools to help you plan and prepare.
Subjects:
Grades:
9th - 12th

Zombies: You Are Doing Them Wrong!
Abstract:
Zombies are a popular figure in pop culture/entertainment and they are usually portrayed as being brought about through an outbreak or epidemic. Consequently, we model a zombie attack, using biological assumptions based on popular zombie movies. We introduce a basic model for zombie infection, determine equilibria and their stability, and illustrate the outcome with numerical solutions. We then refine the model to introduce a latent period of zombification, whereby humans are infected
Subjects:
Grades:
Higher Education, Adult Education, Staff
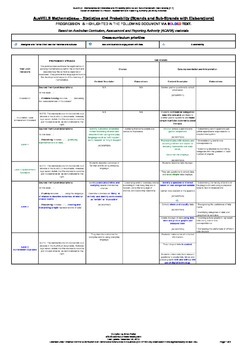
Progressive Framework AusVELS Mathematics AC – Statistics & Probability (F-7)
AusVELS - Progressive Framework - Mathematics AC - Statistics & Probability - Strands and Sub-strands with Elaborations (F-7)
Learn about the myriad of ways these documents can be used by visiting http://effectivecurriculumideas.weebly.com/tutorials-using-the-progressive-curriculum-frameworks.html
Subjects:
Grades:
K - 7th
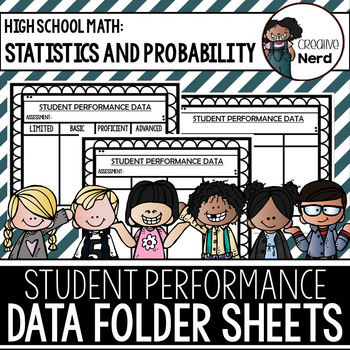
Student Performance Data Folder Sheets (High School Statistics) (Freebie)
Student Performance Data Folder Sheets is a standards based organization tool to help group students for differentiated instruction. This set for High School Statistics and Probability Standards provides 31 graphic organizers labeled for each Common Core State Standard as well as three blank organizers. Each sheet includes space for intended assessment, teacher notes and performance level categories (limited, basic, proficient, advanced). This resources can be used for data folders, data talks,
Subjects:
Grades:
9th - 12th

Theorists and Implementation
A quick reference guide to popular theorists and how they can be implemented into the classroom.
Subjects:
Grades:
Staff
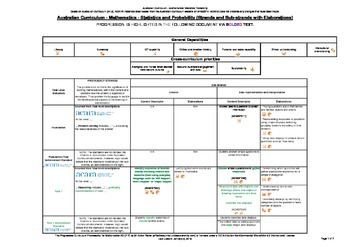
Australian Curriculum - Progression - Maths (v7.2) Stats & Probability (F-7)
Australian Curriculum - Progressive Framework - Mathematics (v7.2) - Statistics & Probability - Strands and Sub-strands with Elaborations (F-7)
Subjects:
Grades:
PreK - 7th
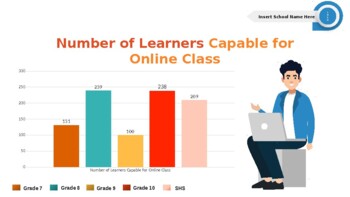
Animated School Report/Infographics for Staff and Teachers
This product is composed of different animated graphs/charts needed for school reports and statistics such as:Number of enrolleesNumber of DropoutsAssesment ResultsCapability of learning onlineNumber of transfereeAnd many more. All of them are editable for your own data.This is perfect for school heads/teachers/principals/staff.
Grades:
Not Grade Specific
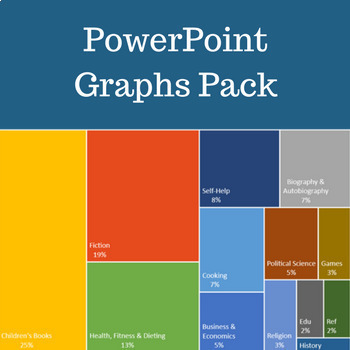
PowerPoint Graphs for Data Visualization and Presentation
This free version includes 9 fully editable PowerPoint graphs.
★ Download 100+ PowerPoint Graph Templates for Data visualization and Presentation (with FREE UPDATES) ★
Get all stunning data chart templates here - 100+ PowerPoint Graph Templates for Data visualization and Presentation (with FREE UPDATES)
Subjects:
Grades:
5th - 12th, Higher Education, Adult Education, Staff
Showing 1-24 of 27 results


