21 results
1st grade statistics homeschool curricula for staff
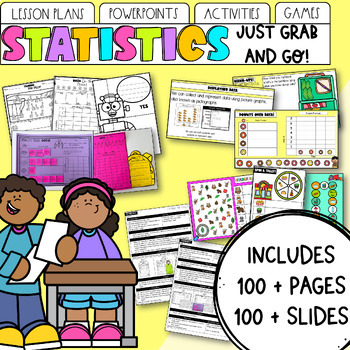
Statistics & Data | Maths Unit: Lessons, PowerPoint, Activities & Games
Looking for statistics and graphing planning that ticks all your boxes? Look no further! Teaching is hard enough, without spending hours creating differentiated lesson plans and activities. Not to mention the time spent planning what your early finishers can do, what assessment points to consider, or sourcing games that consolidate previous skills! With this Statistics and Data Unit, everything is done for you. Want to buy in early to the discounted bundle and get all updates for free? Find my G
Subjects:
Grades:
K - 2nd
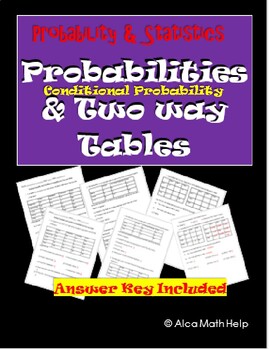
Conditional Probability and Two-Way Worksheet, CW, HW, Review CP Stats, Ap Stats
If you are looking for an easy to follow for students. You are at the right place. This is a quick and easy to follow activity sheet that brings across the concept clear and precise. Teachers in my department love this activity sheet. This is useful of CP Probability and Statistics, AP Statistics and Algebra 1 statistics unit.Probability and Conditional Probability ObjectivesAt the end of the lesson students should be able to:1. Interpret two-way tables2. Create relative frequency tables for wh
Subjects:
Grades:
9th - 12th, Higher Education, Adult Education, Staff
CCSS:
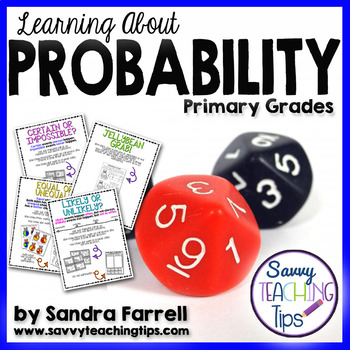
Probability - a unit for primary grades
PROBABILITYWelcome to my unit on probability and data analysis.Although this unit is designed for students in Second Grade, there are different levels of black line masters to allow for differentiated learning. This unit is designed to introduce and review the standards around collecting data, sorting data, analyzing data and problem solving at the Grade 1 to 3 levels. This unit covers these Common Core Standards:CCSS.Math.Content.2.MD.D.10CCSS.Math.Content.1.MD.C.4CCSS.Math.Content.3.MD.B.3Th
Subjects:
Grades:
1st - 3rd
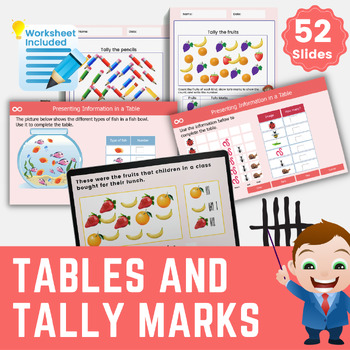
Tables and Tally Charts First Grade Interactive Activities CCSS.1.MD.C.4
This amazing completely interactive lesson with differentiated activities will allow 1st-grade class to interpret and construct simple tally charts and tables. Based on the first grade Common Core State Standards for interpreting and measuring data.Teachers can use the lesson for whole-class teaching as well as at home by learners.There are lots of drag and drop tally charts activities with instant feedback.The lesson contains 52 interactive pages as well as lots of differentiated activities. An
Subjects:
Grades:
1st - 2nd
CCSS:
Also included in: Data and Graphing Activities and Worksheets for First Grade
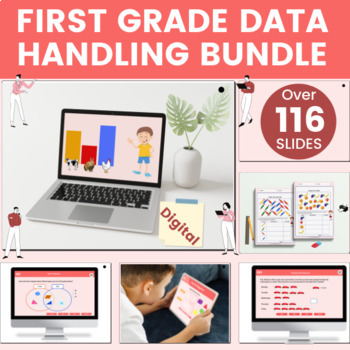
Data and Graphing Activities and Worksheets for First Grade
Data and Graphing Activities and Worksheets for First GradeIntroduce your 1st grade students to data and graphing, including sorting items into groups, tally marks and tally sheets, pictographs, and bar charts. Engage your 1st-grade class with these amazing Data and Graphing Activities and Worksheets for First Grade. A fun-packed interactive math lesson bundle for your grade 1 learners. Buy this great value bundle of interactive lessons today to save you hours of planning and don't forget to lea
Subjects:
Grades:
1st - 2nd
CCSS:
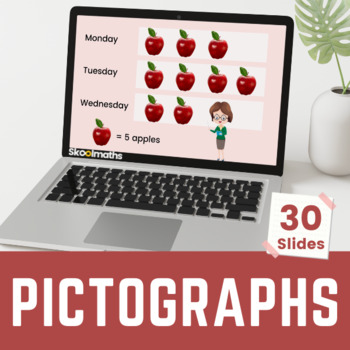
No-prep Interactive Pictograph Digital Activities for 2nd Graders
No-prep Interactive Pictograph Digital Activities for 2nd GradersTake your students' data analysis skills to the next level with our interactive pictograph activities for 2nd graders. These engaging, hands-on resources will help students understand how to represent data visually using pictographs.Learning Objectives:Organize and represent data using pictographs.Analyze and interpret data from pictographs.Understand the relationship between data and its representation in pictographs.Apply knowled
Subjects:
Grades:
1st - 2nd
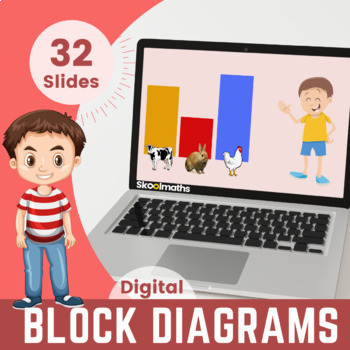
Block Diagrams Interactive Digital Activities for 1st Grade
Block Diagrams | 1st Grade | Interactive Activities #dollardealsBlock diagrams is a completely interactive lesson designed for learners in 1st grade. Buy this great value bundle of interactive lessons today to save you hours of planning and don't forget to leave an honest review if you download this worksheet for TPT credit :)Learning Objectives:Interpret and construct simple block diagrams.Answer simple questions by counting the number of objects in each category.Sort the categories by quantity
Subjects:
Grades:
1st - 2nd
CCSS:
Also included in: First Grade Math Bundle Interactive Lessons, Activities and Worksheets
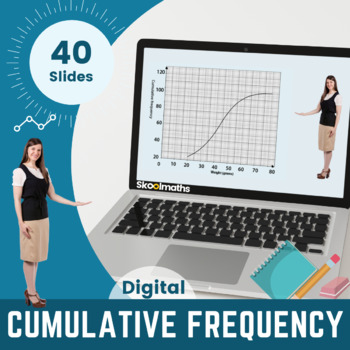
Cumulative Frequency - Digital Lesson and Activities for 9th-10th Grade
In this lesson, learners will be able to:1) construct and interpret cumulative frequency graphs, 2) interpret, analyze and compare the distributions of data sets through quartiles and inter-quartile range The lesson can be used as whole class teaching by teachers and at home by learners.Lots of drag and drop activities with instant feedback. Contains 40 interactive pagesTo open this lesson you need to unzip or extract the files.Choose index.html to view onlineThis lesson can also be viewed offl
Subjects:
Grades:
9th - 10th, Higher Education, Staff
Also included in: Complete Statistics and Probability Bundle | Digital and Print
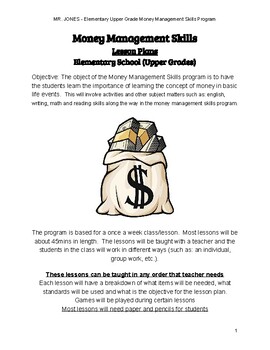
4-6th grade - Money & Math Skills Lessons / Unit (Elementary School)
Elementary School Learn about Money Lesson PlansMoney Management Life Skills (upper grade levels) - SUPER FUN14 lesson plans with worksheets, game details and links includedLessons involved counting money, learning how to invest, learning about bank accounts, what books to read to learn about money and ideas for board games to learn about money.A MUST have for upper grade level teachers/students in elementary school.
Subjects:
Grades:
3rd - 8th, Higher Education, Staff
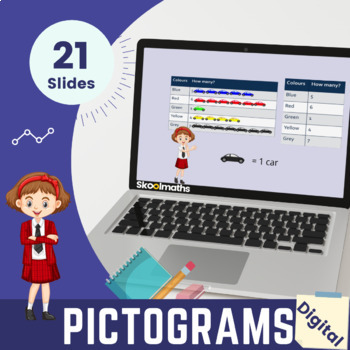
Picture Graphs | Represent and Interpret Data | 2nd Grade Activities
Want an engaging Graphing Unit activity that will teach your learners how to draw a picture graph? Buy this great value bundle of interactive lessons today to save you hours of planning and don't forget to leave an honest review if you download this worksheet for TPT credit :) In this lesson, learners will be able to:Draw a picture graph with a single-unit scale to represent a data set with up to four categories. Interpret and present data using pictograms and tables.Solve one-step and two-step
Subjects:
Grades:
1st - 3rd
Types:
Also included in: Handling Data - 2nd - 3rd Grade Bundle
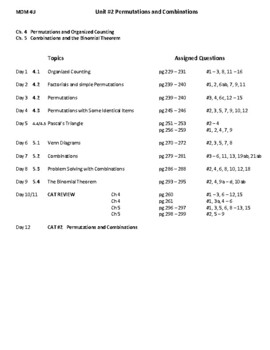
MDM4U Grade 12 Unit #2 Permutations and Combinations MHR textbook
MDM4U Grade 12 Unit #2 Permutations and Combinations Great for the classroom or online learning. This package includes over 32 organized and labeled files created by a teacher with 20 years of experience. This package would be great for any teacher who needs a specific outline for a unit of the course and does not want to do any lesson planning. Would also be great for any student who wants to study to the in depth completed notes. The Unit Plan details the day to day sequence of each topic wit
Subjects:
Grades:
12th, Higher Education, Staff
Types:
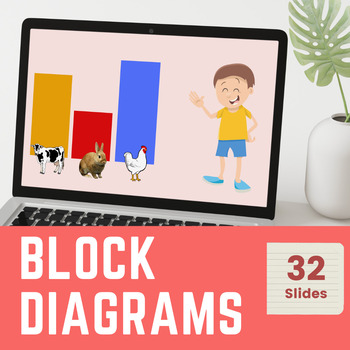
First Grade Bar Graph Fun: Interactive Digital Activities and Worksheets
First Grade Bar Graph Fun: Interactive Digital Activities and WorksheetsTake your first grader's data analysis skills to the next level with our engaging bar graphs digital activities. This no-prep math resource pack includes a collection of interactive activities and printable worksheets designed to introduce young learners to the concept of bar graphs. Your child will learn to read, interpret, and create bar graphs while having fun. Perfect for use in the classroom or at home, these activities
Subjects:
Grades:
1st - 3rd
Statistics and Probability CCSS checklist (trimesters)
This document is a checklist for the Statistics and Probability Common Core State Standards framework. There are multiple columns included to be able to use this document as a checklist for which common core standards you have taught within your course(s) and a column to notate when, how, where you used each standard. This is very useful for planning and implementation of curriculum on an annual basis.
Included in the document are the Standards for Mathematical Practice as well as the CCSS fram
Subjects:
Grades:
9th - 12th, Staff
CCSS:
Statistics and Probability CCSS checklist (quarters)
This document is a checklist for the Statistics and Probability Common Core State Standards framework. There are multiple columns included to be able to use this document as a checklist for which common core standards you have taught within your course(s) and a column to notate when, how, where you used each standard. This is very useful for planning and implementation of curriculum on an annual basis.
Included in the document are the Standards for Mathematical Practice as well as the CCSS fram
Subjects:
Grades:
9th - 12th, Staff
CCSS:
Measures of Position – Quartiles and Percentiles (editable presentation)
Objectives of PPT (57 slides):To be able to find Quartiles, Percentiles, and Z-Scores.To be able to draw box plots.
Subjects:
Grades:
9th - 12th, Higher Education, Adult Education, Staff
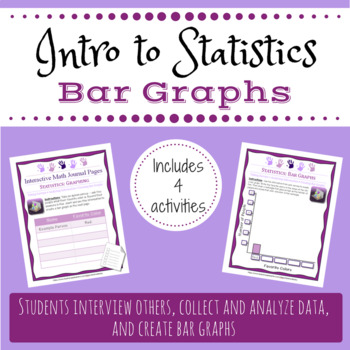
Intro to Statistics Bar Graphs
This hands-on activity gives students the opportunity to interview others, collect and analyze data, and create bar graphs to visually represent the information.
This activity can be used in math centers or one-on-one with students (K-2nd grade) to help them practice some basic statistics skills.
A blank chart and bar graph are included to give kids a chance to make up their own survey questions.
See my store for several other Interactive Journal Pages activities for Pre-K-2nd grade math.
Subjects:
Grades:
PreK - 2nd
Types:
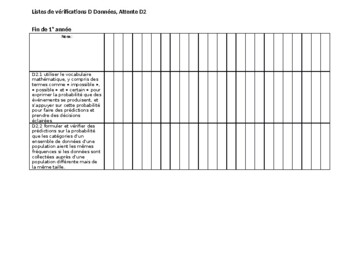
Tableau de curriculum de maths, Ontario 2020, Domaine D2
Voici le nouveau curriculum de maths, Domaine D2 (Données) sous forme de tableau Word, prêt à accepter les noms de vos élèves pour vous servir de liste de vérification ou évaluation. Vous pouvez également y mettre les mois de l'année afin de travailler votre planification à long terme! Toutes les attentes sont inclues, de la 1ère année à la 6ème, avec seulement de petits changements afin de faire rentrer toutes les attentes sur une seule page. Autres domaines disponibles!
Subjects:
Grades:
1st - 6th, Staff
Also included in: Tableaux de curriculum de maths, Ontario 2020
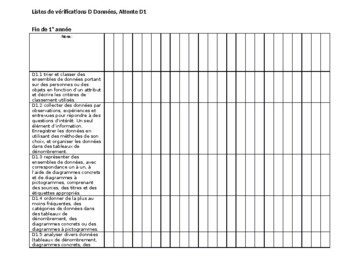
Tableau de curriculum de maths, Ontario 2020, Domaine D1
Voici le nouveau curriculum de maths, Domaine D1 (Données) sous forme de tableau Word, prêt à accepter les noms de vos élèves pour vous servir de liste de vérification ou évaluation. Vous pouvez également y mettre les mois de l'année afin de travailler votre planification à long terme! Toutes les attentes sont inclues, de la 1ère année à la 6ème, avec seulement de petits changements afin de faire rentrer toutes les attentes sur une seule page. Autres domaines disponibles!
Subjects:
Grades:
1st - 6th, Staff
Also included in: Tableaux de curriculum de maths, Ontario 2020
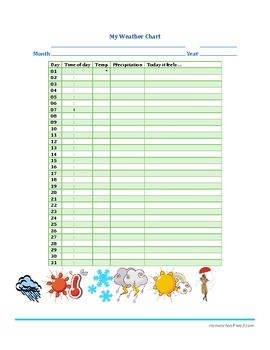
My Weather Chart
Daily weather log with penmanship lines for child to fill in month and year.
Each day the child records the time, temperature, precipitation and how it feels.
This is a 2 page PDF for easy duplex printing to save paper and easily insert into a notebook or folder.
My Weather Chart by HomeschoolFreeB is licensed under a Creative Commons Attribution-NonCommercial-NoDerivs 3.0 United States License.
Subjects:
Grades:
PreK - 3rd

Common Core Standards for Measurement and Data for K-5
The Common Core Standards for Measurement and Data for K-5 are listed.
Subjects:
Grades:
K - 5th
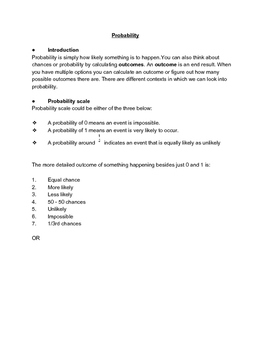
Probability
What is probability, probability scale, types of probability depending on various factors , calculating probability using tree diagram, problem statements.
Subjects:
Grades:
K - 2nd
Showing 1-21 of 21 results


