9 results
Statistics interactive whiteboards for staff
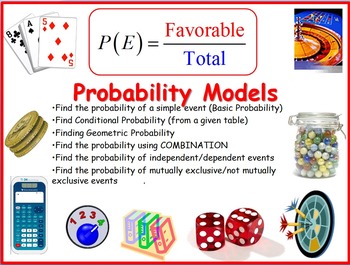
Probability Models
This handout drills the understanding of the different models of probability. Student would have to first determine under which model should this problem fit, then, apply the appropriate strategy to answer the questions. There are many ways to answer each of the questions provided in this handout. I provided "An" answer key.
In this handout, you will find a set of 40 questions on the following probability models:
1. Detailed visual description of the Standard Deck of Cards
2. Basic Probab
Subjects:
Grades:
6th - 12th, Higher Education, Adult Education, Staff
Box and Whisker Plots Smartboard Slides Lesson Step by Step How to Constuct
Math Teachers ~ You'll LOVE this GREAT Smartboard-Slides-LESSON that teaches students step-by-step how to construct a Box-and-Whisker-Plot; Least/Greatest Value, Lower/Upper Quartile, Median, and how to Find the Interquartile and Range. 37 slides in all! Your students will LOVE this smartboard lesson. WARNING: You MUST have SMART Technologies SMART software, and a SMARTBOARD to teach from, to effectively download, open and use this Interactive Smartboard Lesson. Go to https://legacy.smarttech.co
Subjects:
Grades:
5th - 8th, Staff
Also included in: Box & Whisker Plots Smartboard Slides Notes Worksheet BUNDLE
Dot Plots and Data Distribution Displays Smartboard Slides Lesson
Dot-Plots and Data-Distribution Smartboard-Slides-Lesson covers Data-Distribution and Creating Dot-Plots. Lots of practice problems provided. You'll love using this Smartboard Lesson to teach from year after year! WARNING: You MUST have SMART Technologies SMART software, and a SMARTBOARD to teach from, to effectively download, open and use this Interactive Smartboard Lesson. Go to https://legacy.smarttech.com/en/products/education-software/smart-learning-suite/download/trial to download a free t
Subjects:
Grades:
4th - 7th, Staff
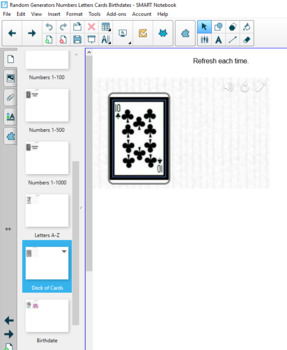
Random Number Letter Deck of Cards Birthday Generator SMART 18 Flash Replacement
If your district has upgraded to Windows 10 and SMART 18, then many of your highly-used flash components will no longer work. I have been recreating them in the new SMART 18. These Random Generators (Numbers 1-36, Numbers 1-100, Numbers 1-500, Numbers 1-1000, Letters A-Z, Playing Card from a Deck of Cards, & Birthdate) are comparable to what was previously available in SMART, though they operate differently.Random Generators SMART 18 Flash Replacement by Brian Tillmann is licensed under a Cr
Subjects:
Grades:
K - 12th, Staff
Types:
Median Mode Range Smartboard Slides Lesson Measures of Central Tendency
Incredible ~ 31 slides ~ Smartboard-Slides-Math-Lesson over Median, Mode, and Range (Measures of Central Tendency). This is EVERYTHING you need to teach these three measure-of-central-tendencies. Students will enjoy the interactive slides where they work problems at the Smartboard. Please be sure to see my other smartboard lesson on Finding the Mean, Average. You'll enjoy using this resource year after year. WARNING: You MUST have SMART Technologies SMART software, and a SMARTBOARD to teach from
Subjects:
Grades:
4th - 7th, Staff
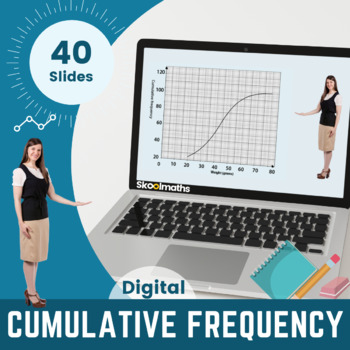
Cumulative Frequency - Digital Lesson and Activities for 9th-10th Grade
In this lesson, learners will be able to:1) construct and interpret cumulative frequency graphs, 2) interpret, analyze and compare the distributions of data sets through quartiles and inter-quartile range The lesson can be used as whole class teaching by teachers and at home by learners.Lots of drag and drop activities with instant feedback. Contains 40 interactive pagesTo open this lesson you need to unzip or extract the files.Choose index.html to view onlineThis lesson can also be viewed offl
Subjects:
Grades:
9th - 10th, Higher Education, Staff
Also included in: Complete Statistics and Probability Bundle | Digital and Print
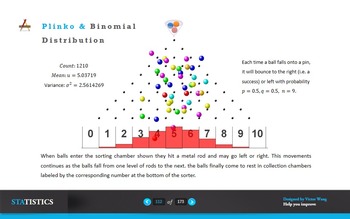
Binomial Distribution
• use formulae for probabilities for the binomial distribution, and
recognise practical situations where the binomial distribution is a
suitable model (the notation B(n, p) is included);
• use formulae for the expectation and variance of the binomial
distribution.
Subjects:
Grades:
10th - 12th, Higher Education, Staff
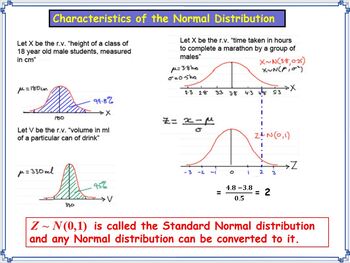
The Normal Distribution (Standardising and using Statistical Tables)
Working out probabilities using Normal Distribution (Standardising and using Statistical Tables) - Fully planned interactive lesson with step by step guide on how to standardise and use Standard Normal Distribution Statistical Tables in a variety of context.
Subjects:
Grades:
10th - 12th, Higher Education, Adult Education, Staff
Showing 1-9 of 9 results


