4 results
10th grade The New Year graphing resources for Montessori
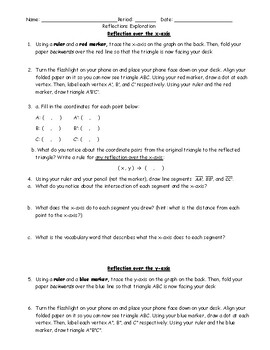
Reflections Exploration Inquiry Activity
Students learn about reflections and creating rules for reflections by folding a graph over itself in different directions.Supplies needed:-Markers, colored pencils or highlighters (helps show the different iterations more clearly)-Phones with flashlights or a bright window
Grades:
10th
Types:
CCSS:
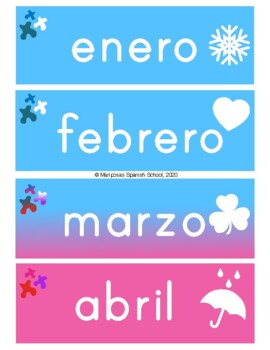
Los Meses del Año - The Months of the Year Flashcards
These beautiful flashcards are color coded to correspond to the seasons. Following Montessori's style, they pair seamlessly with our month's of the year poster and our seasons flashcards. Many games can be played with the combined sets. About: Letter sized flashcards of the 12 months of the year in Spanish. High resolution works best for printing. Use songs to enhance your teaching! When presenting the months, incorporate our fun Mariposas song "Los Meses" from our "A Celebrar" album. Availab
Subjects:
Grades:
PreK - 12th
Also included in: Los Meses Bundle
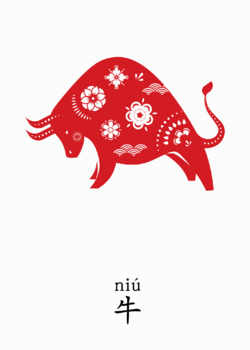
Chinese Zodiac Animal Chinese Learning Flashcards for Kids
This Chinese Zodiac Animal flashcard set includes 12 different cards of the following Chinese zodiac animals:- 鼠 rat- 牛 ox- 虎 tiger- 兔 rabbit- 龙 dragon- 蛇 snake- 马 horse- 羊 goat- 猴 monkey- 鸡 rooster- 狗 dog- 猪 pigThe Montessori 3-Part cards consist of1. control card with image, pinyin, and Chinese word2. image card that only shows the image of an object3. Chinese word card (label of the object)There are two sizes for you to choose from:5"x7" is a large size, perfect for little ones.4"x5.2" is a s
Subjects:
Grades:
PreK - 12th
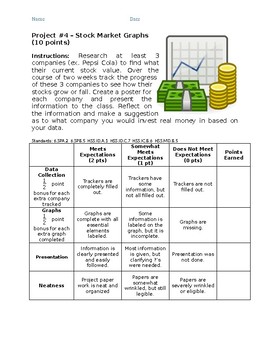
Stock Market Graphs
Students use their skills to track and interpret trends with at least 3 current companies. They collect data on stock price for two weeks, graph the information, then make predictions about what they think will happen based on the trends. Great for use in finance and investment classes, math, or science to collect and analyze data. I used this in my middle school RTI classes for project-based learning. Let me know what you think or how I might make it better. Thank you!
Subjects:
Grades:
6th - 12th
Types:
Also included in: Math Projects Bundle
Showing 1-4 of 4 results


