44 results
Elementary statistics flash cards for homeschool
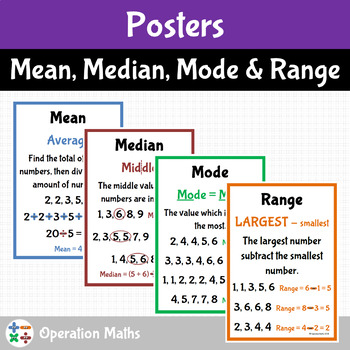
Mean, Median, Mode and Range Posters
These bright and colourful posters can be used for display or laminated and used during lessons.The pack includes the following with an explanation and at least one example of how to work them out.· Mean poster· Median poster· Mode poster· Range poster· All four posters on one pageThe A to Z Booklet for Mean, Median, Mode and Range can be found here.
Subjects:
Grades:
5th - 8th
Types:
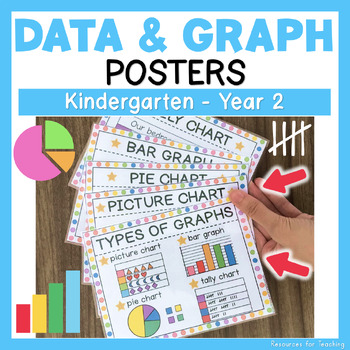
Types of Graphs Maths Posters for Kindergarten, Year 1 and 2 Students
An excellent learning tool for Kindergarten, Year 1 and 2 students. Aligned with the Australian Curriculum (ACMSP263, ACMSP048, ACMSP049 & ACMSP050).These colourful posters can also be used as display cards for children learning how to collect, interpret and organise data in math lessons. All these posters are fantastic during a class discussion to differentiate between different graphs by looking at the physical characteristics and then interpreting the information.Posters include:1) Types
Subjects:
Grades:
K - 2nd
Types:
Also included in: DATA AND GRAPHING BUNDLE: YEAR 1 AND 2 MATHS
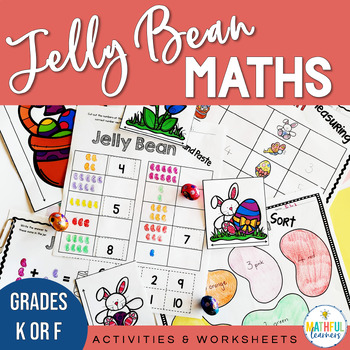
Jelly Bean Math - Easter Themed No Prep Math Activities & Worksheets
This Jelly Bean Math pack of no prep Math activities and worksheets is fun, engaging and your students will love it! This 25 page pack will help you cover many areas of the Math Curriculum in just ONE week. The Easter themed Math activities and worksheets are perfect for that week before Easter, or anytime of year. It contains activities relating to numbers, counting, addition and subtraction, shape, data collection and measurement all perfect for Kindergarten/Foundation students.A week of your
Subjects:
Grades:
PreK - 1st
Types:
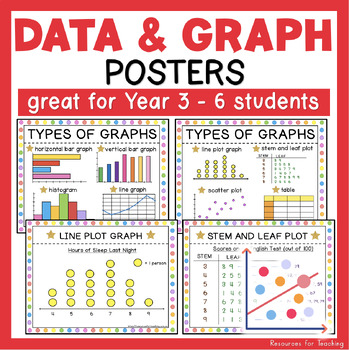
Types of Graphs Maths Posters for Year 3, 4, 5 & 6 Students
These vivid types of graphs maths posters are perfect for Year 3, 4, 5 & 6 students learning to collect, interpret and organise data in math lessons. All these posters are fantastic for using during a class discussion to differentiate between different graphs by looking at the physical characteristics and then interpreting the information. The Posters Include:1) Types of Graphs: horizontal bar graph, vertical bar graph, histogram, line graph, line plot graph, stem and leaf plot, scatter plot
Subjects:
Grades:
3rd - 6th
Types:
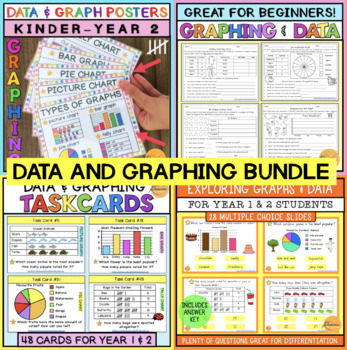
DATA AND GRAPHING BUNDLE: YEAR 1 AND 2 MATHS
This data and graphing BUNDLE is a massive time-saver for Year 1 & 2 teachers! Includes plenty of materials that are wonderful for teaching students how to interpret, analyse and collect data. This download comes with informational slides, multiple choice questions, task cards, worksheets and posters that are engaging and helpful for students during maths lessons! Includes plenty of different tasks that are wonderful for differentiation in the classroom.What's Included?1. Exploring Graphs an
Subjects:
Grades:
1st - 2nd
Types:
Statistics for Business and Economics 14th Edition By James, George TEST BANK
TEST BANK for Statistics for Business and Economics 14th Edition James T. McClave; P. George Benson; Terry T SincichTABLE OF CONTENTSCHAPTER 1. Statistics, Data, and Statistical Thinking CHAPTER 2. Methods for Describing Sets of DataCHAPTER 3. ProbabilityCHAPTER 4. Random Variables and Probability DistributionsCHAPTER 5. Sampling Distributions CHAPTER 6. Inferences Based on a Single Sample: Estimation with Confidence IntervalsCHAPTER 7. Inferences Based on a Single Sample: Tests of HypothesesCHA
Subjects:
Grades:
Higher Education, Adult Education, Staff
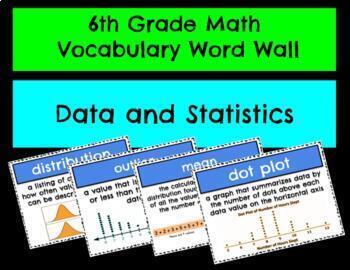
6th Grade Math Vocabulary Word Wall -- Data and Statistics
All of the math vocabulary words you need to teach data and statistics for 6th grade. The set includes both full color versions of the vocabulary posters which can be used on a word wall, distributed via Google Classroom, or as part of a student interactive notebook.
Subjects:
Grades:
5th - 7th

High School Math Mystery Challenge
There is a murder in the district and detective Simpson has been called to the murder scene. But he needs to put his Math skills to use in order to solve the clues leading to the murderer. Can he do it? Time is ticking away so he needs to work fast!
This is a murder mystery game that requires students to be grouped in teams of three or four and solve various Math problems to solve the mystery.
Topics covered include:
1. Differentiation
2. Graphs
3. Statistics & Probability
4. Algebra
5. Si
Subjects:
Grades:
11th - 12th
Types:
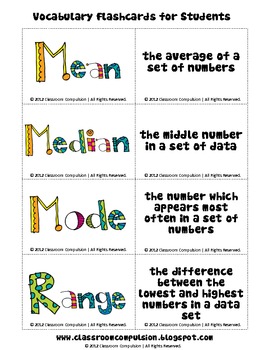
FREE Mean Median Mode Range Fun Flashcards
This is a freebie from my Mean, Median, Mode, and Range Pack. These are fun, colorful flashcards that your students can use to help them learn math vocabulary.
Subjects:
Grades:
3rd - 9th
Types:
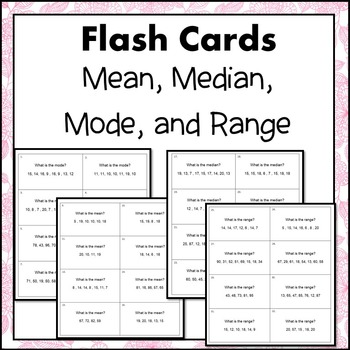
Mean, Median, Mode, and Range Flash Cards or Task Cards
Mean, median, mode, and range flash cards or task cards. This set contains 32 cards.
***************************************************************************
Flash Cards:
Print the questions and the answers. Copy back to back on color paper. Cut out the cards and laminate. Each card has a question on the front and the answer on the back. Students will check themselves.
Task Cards:
Print the numbered question cards only. Copy onto color paper. Cut out the cards and laminate. Print studen
Subjects:
Grades:
5th - 6th
Types:
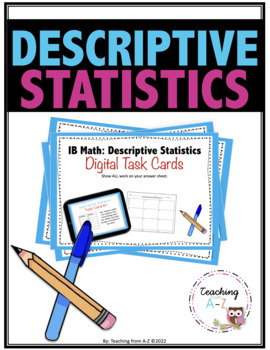
IB MAI Topic 4 Descriptive Statistics Digital Task Cards
These are 15 digital task cards that you can use as a quick review with your IB Math students. You can use them to review as soon as you’ve covered the descriptive statistics portion of the class, OR (my favorite) I use them as a review once we’ve moved on to another topic (like geometry and trigonometry) to make sure they haven’t forgotten the descriptive statistics portion of the class.THIS IS INCLUDED in the IB Mathematics Topic 4 Descriptive Statistics Notes, HW, Quizzes and Test Resource.It
Subjects:
Grades:
10th - 12th
Mean Task Cards
Mean Task Cards.In this packet you will find 24 Task Cards, Recording Sheet and Answer key.Table of Contents.Cards 1-4 : Calculate averages of 2 digits.Cards 5-8 : Calculate averages of 3 digits.Cards 9-12 : Calculate averages of 4 digits.Cards 13-16 : Calculate averages of 5 digits.Cards 17-20 : Calculate averages of 6 digits.Cards 21-24 : Calculate averages of 7 digits.Print on cardstock, laminate and cut out each set of cards.----------------------------------You May Also Like These Worksheet
Subjects:
Grades:
5th - 6th
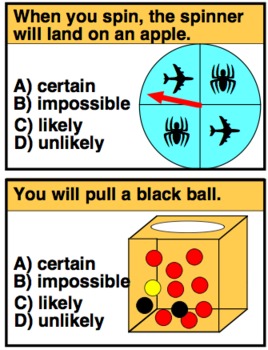
Probability Practice Cards and Worksheets
These probability cards allow students to practice the academic language for probability and can be used in many different ways. You can use them for enrichment math groups, center activities, gallery walks, playing games like scoot, or supplementing any calendar math you may use.
I created these to supplement my calendar math program. There are a total of 20 color cards; 1 for each school day of the month. I recommend you print the colored cards on cardstock and laminate the sheets. Once they
Subjects:
Grades:
3rd - 4th
Types:
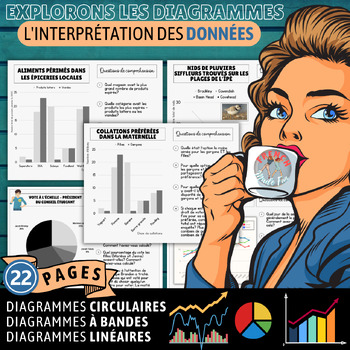
FRENCH MATHS | CHARTS | DIAGRAMMES | REPRÉSENTATION GRAPHIQUE | INTERPRÉTER
Creating charts that are precise, effective, visually appealing and authentic is a pretty big feat! Do away with the anchor chart paper and the countless hours or prep-work and use these to amp up your teaching! I use these with my grades 5 and 6 students in my split class, but they can easily be used as Reachback or revision in grade 7 or for students needing extra exposure; like younger students who are enriched or older students who are in adaptation scolaire.This collection of 11 charts with
Subjects:
Grades:
5th - 6th
Types:
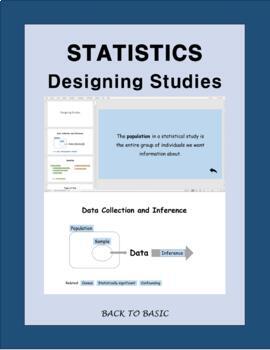
AP Statistics Designing Studies - Sampling, Observational Study, and Experiment
Hello,I created this teaching material to organize key ideas of designing studies with statistical terminologies. While teaching statistics to students, I realized that many students find statistics course challenging and one of the reasons for that is because they struggle to see overall ideas of topics. In this powerpoint presentation, the overall ideas of designing studies are organized and definitions of key ideas and vocabulary are linked so that they can be seen if you click the words. In
Subjects:
Grades:
9th - 12th, Higher Education
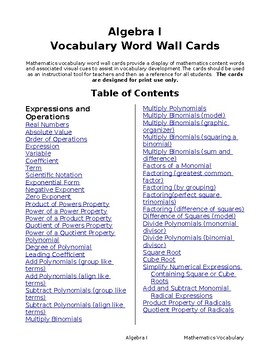
Algebra I Vocabulary Posters (110 Pages )
Looking for a quick and easy way to practice Math Vocabulary?These colorful and concise Posters and Flashcards are a great way to reinforce math concepts. Hang on a bulletin board and keep on a ring for reviewing.
Subjects:
Grades:
6th - 12th, Higher Education, Adult Education
Types:
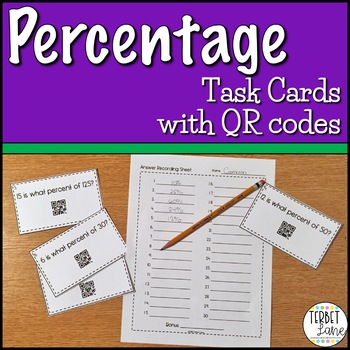
Percent of a Number Activity Task Cards
Learning about percentages with task cards is a fun alternative to worksheets. This percent of a number activity includes both printable and TpT digital formats. Each percent of a number activity card includes QR codes to allow students to check their own answers, Students can also quiz each other using the QR codes. Most cellphones or tablets with a camera have the ability to read these codes and should not require a special app. Great for math centers and distance learning or homeschool. Skill
Subjects:
Grades:
6th - 8th
Types:
Math Vocabulary Posters & Flash Cards for grade 8(Editable & fillable resource)
Looking for a quick and easy way to practice Math Vocabulary?These colorful and concise Posters and Flashcards are a great way to reinforce math concepts. Hang on a bulletin board and keep on a ring for reviewing.
Subjects:
Grades:
7th - 9th
Types:
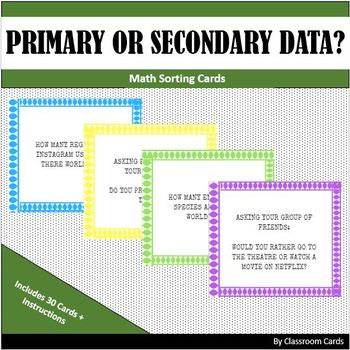
Primary or Secondary Data? Math Sorting Cards
This resource helps students to identify whether the data collected is primary or secondary. Some cards have a survey question, while others have a specific scenario. This is a great way to differentiate instruction as part of a Data Management unit.
Subjects:
Grades:
4th - 8th
Types:
Mean, Median, Mode, and Range Task Cards
Mean, Median, Mode, and Range Task Cards.In this packet you will find 24 Task Cards, Recording Sheet and Answer key.Print on cardstock, laminate and cut out each set of cards.----------------------------------You May Also Like These Worksheets:Mean, Median, Mode, and Range WorksheetsAverages WorksheetsYou May Also Like These Task Cards:Mean Task CardsBe the first to know about my new discounts, freebies and product launches:- Look for the green star next to my store logo and click it to become a
Subjects:
Grades:
4th - 7th
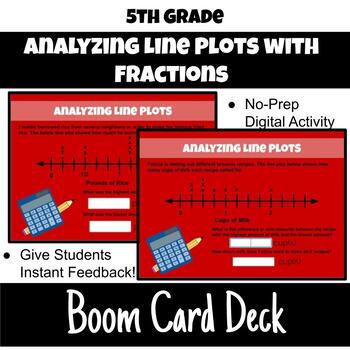
5.MD.2 5th Grade Analyzing Line Plots with Fractions Boom Cards Activity
Need some fun, engaging problems for students on analyzing line plots with fractions? This 14 card boom deck set is perfect. This Boom Card Deck contains 3 line plot scenarios that each contain 6-8 analyzing questions. These questions include: -Finding the difference between highest and lowest points. - Finding the greatest value and lowest value in a data set. -Analyzing how many more have above a certain level versus below a certain level. -Finding the total number of data points. Use this for
Subjects:
Grades:
5th - 6th
Types:
CCSS:
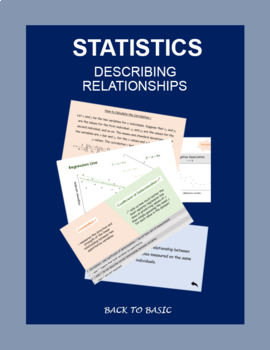
AP Statistics Describing Relationships - Correlation, Residuals, Regression Line
I created this PowerPoint slides to organize key ideas of AP Statistics Chapter 3 Describing Relationships. This PowerPoint is designed to help students understand the connections among key terminologies and see the overall ideas. I used diagrams and color codes to better organize related concepts and linked newly introduced terminologies to corresponding vocabulary cards. Vocabulary cards can be used separately as you teach each terminology or can be referred to as you use the slides showing re
Subjects:
Grades:
9th - 12th
Types:
South Carolina Grade 5 Math I Can Statement Posters
These are half-page posters featuring the South Carolina 5th Grade Mathematics curriculum standards in I Can Statement format. All of the strands of Math are covered. In today's classrooms where accountability is all important, teachers are expected to display the standards that are being taught at any given time during the school year. This product has all the work done for you. Simply print them off and laminate them for use year after year.
The large print and the bright colors make it possi
Subjects:
Grades:
5th
South Carolina Grade 6 Math I Can Statement Posters
These are half-page posters featuring the South Carolina 6th Grade Mathematics curriculum standards in I Can Statement format. All of the strands of Math are covered. In today's classrooms where accountability is all important, teachers are expected to display the standards that are being taught at any given time during the school year. This product has all the work done for you. Simply print them off and laminate them for use year after year.
The large print and the bright colors make it possi
Subjects:
Grades:
6th
Showing 1-24 of 44 results


