45 results
Laboratories for Microsoft Excel and for homeschool under $5
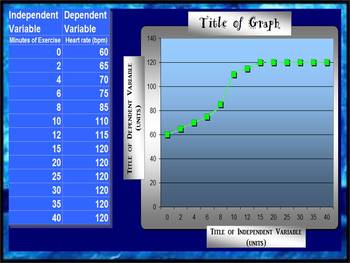
LINE GRAPH MAKER (AUTOMATIC)
This spreadsheet allows you to insert your independent and dependent variables into a chart and voila!... a line graph is generated as you enter in each piece of new data! Students love to take their data from a lab and watch as a graph is made right before their eyes! You can change all of the titles on the chart and the graph to suit your classes laboratory experiment needs! Students can easily print out their data to include in their lab reports!
Grades:
2nd - 12th
Types:
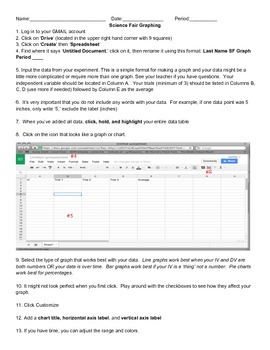
How To Graph Using Google Spreadsheets
This is a step-by-step guide on how to use Google Spreadsheets for students in grades 5-12. Use this as a resource when guiding students through the process. Included with the directions is sample data for students to use when practicing graphing. Perfect for science experiments and science fair!
Subjects:
Grades:
5th - 12th
Types:
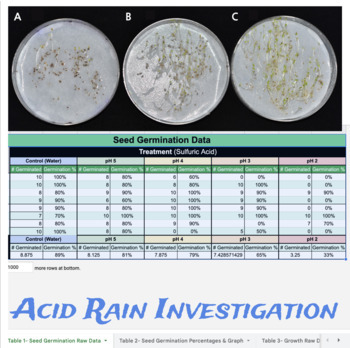
Acid Rain Lab Investigation (A Seed Germination Study)
INCLUDED:Google Doc with Google Sheet Link!Google Sheets with automatically perform ALL calculations and produce graphs! In this lab, students model the effects of acid rain on plant structure and function by studying seed germination in various pH treatments. In this investigation students will expose the seeds to various solutions of acid treatments and document the effects on seed germination. By exposing the seeds to various pH levels in a controlled environment, students can determine at wh
Subjects:
Grades:
7th - 12th
Types:
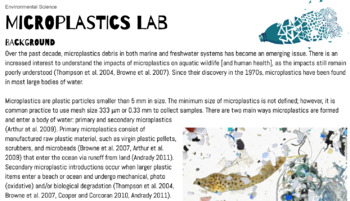
Microplastics Lab (Microscopic Analysis, Chemical Isolation, Food)
This is one of my favorite labs to do with my Environmental Science kids! It has 3 parts: Microscopic analysis of beach sand (you can substitute with any substrate you think might have microplastics!), microscopic analysis of everyday objects (I have my students look at food/snacks that they bring in, and do a dissection of clams/mussels from the grocery store), and chemical isolation/digestion of microplastic-containing samples of muck (we get ours from a pond and a beach). For the chemical dig
Subjects:
Grades:
8th - 12th, Higher Education, Adult Education
Types:
BAR GRAPH (AUTOMATIC)
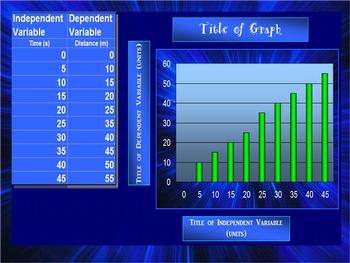
This spreadsheet allows you to insert your independent and dependent variables into a chart and voila!... a bar graph is generated as you enter in each piece of new data! Students love to take their data from a lab and watch as a graph is made right before their eyes! You can change all of the titles on the chart and the graph to suit your classes laboratory experiment needs! Students can easily print out their data to include in their lab reports!
elementary science class, middle school sc
Grades:
2nd - 12th
Types:

Biotic Index Field Study
In this outdoor Field Study, students compare the ecological health of two freshwater sites based on macroinvertebrate biodiversity found using leaf packs. GOOGLE DOC & easy to use GOOGLE SHEETS INCLUDED!Also includes Quizlet Set and other Resources!STEPS:Collect leaves and place them in a mesh or coconut fiber bundle (leaf pack).Students place the "leaf pack" on the bottom of a freshwater stream.Students will return to the sites to collect the leaf packs after 1-3 weeks. Bins, dissection
Subjects:
Grades:
8th - 12th, Higher Education
Types:
NGSS:
HS-LS2-2
Fish Frequency Lab (Companion Spreadsheet) for Hardy Weinberg Equilibrium
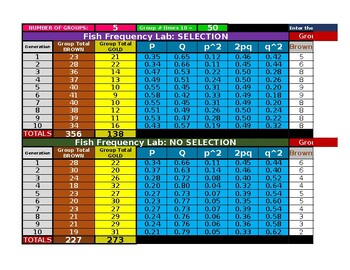
This is the companion spreadsheet that will help calculate and display class data for the lab.Understanding natural selection and the Hardy-Weinberg Equilibrium equation can be confusing and difficult.Let this lab activity help clear some of the confusion for your students! In this laboratory activity, you will use fish crackers to help further your understanding of natural selection and the role of genetics and gene frequencies in evolution and natural selection.The only supplies you need are 2
Grades:
9th - 12th, Higher Education, Adult Education
Types:
NGSS:
HS-LS4-2
, HS-LS4-1
, HS-LS4-6
, HS-LS4-3
, HS-LS4-4
...
6 Do At Home Physics Labs
These labs can be performed in school or at home with or without partners. Equipment needed: m&m’s; cell phone or watch w stopwatch function, clay or Play Dough; small stones; a marble or a golf ball; a couple of rulers or small sticks; a 2-foot board or cookie baking sheet; 2 books or boards to slap together to make a loud noise. Included are:1. Measuring the acceleration of gravity. Drop stones out of a second story window or down a stairwell and measure fall times with stopwatch on a c
Subjects:
Grades:
10th - 12th
Types:
CCSS:

Science Lab Report Classical Conversations Challenge II Editable
I edit and use this to help my homeschooler with lab reports. We use it for Classical Conversations Challenge 2 Apologia Biology. You can use it for other curriculums. It is editable.
Grades:
8th - 12th

Google Spreadsheet: Shoe Cleaning Lab
The "Making Babies Lab: Baby Yoda" and "Characteristics of Life Lab" had such great feedback from other educators I thought I would go ahead and make a similar one with one of my favorite introductory experiments: the "The Perfect Clean" Virtual Lab!Guiding Question: Which cleaning methods are most effective for cleaning tennis shoes?Supplementary Resources: Instructional Video Part 1Teacher Tips:1. Hook (CTE Connection:) Introduce students to the topic by showing them some videos of new busines
Grades:
6th - 12th, Higher Education
Types:
NGSS:
MS-ESS3-2
, MS-ESS3-1
, MS-ESS3-5
, MS-ESS3-4
, MS-ESS3-3
Study the acceleration of a Rocket - video analysis
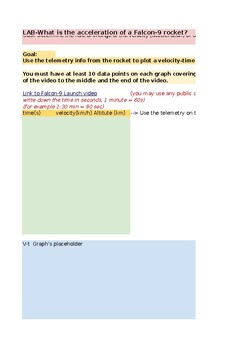
Use video analysis to measure the acceleration of a falcon 9 rocket. How to determine the position, velocity, and acceleration of the rocket over time? How to use the data collected to analyze the rocket's motion? This lab activity is divided in four main sections, Introduction, data collection and data plotting , Analysis questions, and post-lab questions. any online source showing telemetry from a rocket launch may be used.
Subjects:
Grades:
9th - 12th, Higher Education, Adult Education, Staff
Types:
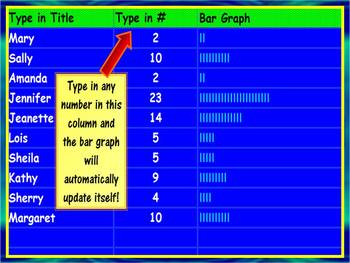
Automatic Bar Graph Maker
This activity can be used to teach students of all ages about bar graphs. This spreadsheet can be used to introduce the concept of bar graphs to elementary students as well as implemeted by mid-level & high school students in lab reports and/or presentations. It is extremely quick and easy to use! Just type in a set of numbers and it automatically creates a simple bar graph. And check out my other graph templates for line and bar graphs! They are definately worth your time!
Grades:
K - 12th
Types:
Pi activity for High School students
Determining the value of π experimentallyIn this activity, students use circular objects to find the value of pi (π) experimentally. It can be used as a lab activity in Science classes where students practice their data collection and graphing skills. OR, math teachers can use it as an activity for Pi Day. The activity goes over two methods to plot the data collected: MS Excel and graph paper. For students who have not mastered MS Excel graphing skills yet, the activity involves a link that help
Grades:
9th - 12th
Types:
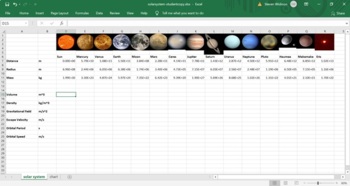
High School Physics - Solar System Lab
This is a computer lab for consolidating astronomy based concepts such as Kepler's laws, Universal gravitation, escape velocity and satellite motion. This package includes a powerpoint for introducing Kepler's laws, an excel file with the orbital elements of the planets, and a fill-in-the-blanks document that guides the students through the tasks of the lab. This is a good activity to do in a high school physics class that covers astronomy related topics. It also gives students good experience i
Subjects:
Grades:
10th - 12th, Adult Education
Types:
CCSS:
NGSS:
HS-ESS1-4
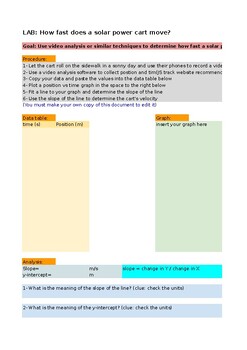
LAB - How fast is a solar cart?
Students study the motion of a solar powered cart using video analysis.Students will determine the speed of a solar cart from a position vs. time graph, and they will also be able to use the information from the chart to describe the motion. Is the velocity of the solar powered cart constant? How constant the velocity is?A video of the motion is uploaded for the video analysis, and a key is also provided. results may differ depending on the cart used.
Subjects:
Grades:
9th - 12th, Higher Education, Adult Education, Staff
Types:
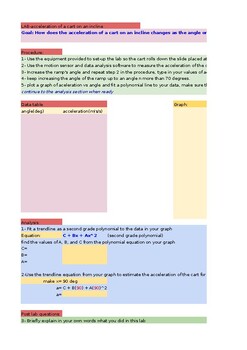
Acceleration of a cart in a ramp
Students will be able to measure the acceleration of a cart down the ramp for different inclination angles, collected data may be used to predict the acceleration of the cart for an angle of 90 degrees by extrapolation. A graph of acceleration vs. sine(angle) should yield a strait line with a slope equals to the free fall acceleration g. A key and student sample data is provided.
Subjects:
Grades:
10th - 12th, Higher Education, Adult Education, Staff
Types:

Chemistry Laboratory: Syringe Pumps (Enrichment Chemistry Series)
The New Era Syringe Systems, Inc. syringe pumps are remarkable. They are perfect for grade-level 9-12, laboratory-course teachers who wish to add STEM chemical-engineering experiments. Large-scale chemical systems – e.g., oil refineries and chemical plants – are flow systems. In contrast, laboratory, small-scale chemical systems – usually round-bottom flasks – are batch systems.
The value of a syringe pump is its enormous range of flow rates – as much as one-million to one -- which depend
Subjects:
Grades:
9th - 11th
Types:
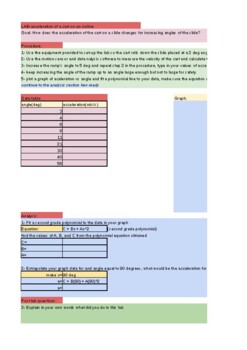
LAB-Acceleration of a cart on a tilting incline
Students investigate the acceleration of a cart down an incline for different incline angles, they will use the data obtained in this investigation to estimate the acceleration the cart would have if the angle is 90 degrees (vertical drop). This lab may be used to make the connection between accelerated motion and free fall motion.
Subjects:
Grades:
9th - 12th, Higher Education, Adult Education
Types:
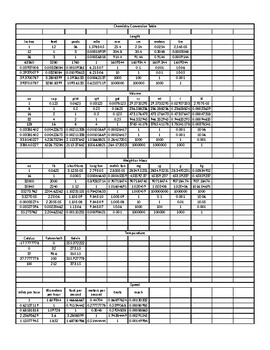
All in one conversion table
The conversion table has just about everything you need to make your daily conversions as well as the scientific conversions that are a bit tougher to do. This spreadsheet contains eight different conversion tables that are easy to use. Each conversion starts with one starting unit that is then converted to all other types of measurements within that group.
Subjects:
Grades:
3rd - 12th, Higher Education, Adult Education
Types:

Design your own house: Adding,subtracting items in real life scenarios
Having trouble motivating your students with adding and subtracting double (or triple digit) addends. Use this great file. I created this excel spreadsheet to allow student to click and drag house layouts, furniture, and even plants to an area of land. Once they choose an item, they type it in the spread sheet and tally it up. There is a self check feature on each page to see if they added or subtracted correctly.
If you have extra time or you want to turn it into a game, print out the car
Subjects:
Grades:
1st - 4th
Types:
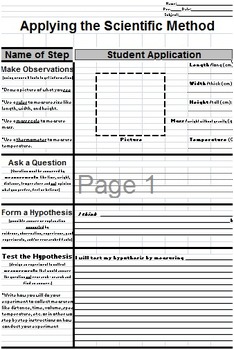
Applying the Scientific Method
This is a generalized but organized format in which students can apply various experiments and visually distinguish the steps of the scientific method. This activity worksheet also includes teaching tips for conducting one simple and cheap experiment involving ladybugs. Don't worry, I give tips to preserve all ladybugs' lives and students usually take them home.
Subjects:
Grades:
6th - 9th
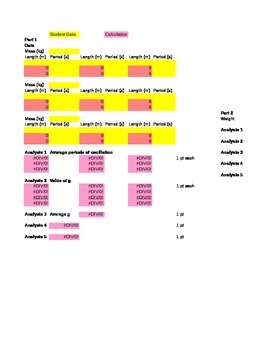
Universal Gravitation Lab Grading Spreadsheet
One of the greatest things about these labs is that each student (or lab group) is responsible for generating their own data, which leads to individual answers. The problem is that grading can be complicated…until now! These grading spreadsheets were originally only available on CD-ROM…but now they can easily be downloaded and used. When the teacher wants to grade a lab, they simply enter the student data into the yellow spreadsheet cells. Then the pink cells automatically calculate the answ
Subjects:
Grades:
7th - 12th, Higher Education
Types:
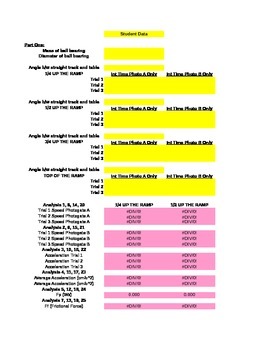
Inclined Planes and Friction Lab Grading Spreadsheet
One of the greatest things about these labs is that each student (or lab group) is responsible for generating their own data, which leads to individual answers. The problem is that grading can be complicated…until now! These grading spreadsheets were originally only available on CD-ROM…but now they can easily be downloaded and used. When the teacher wants to grade a lab, they simply enter the student data into the yellow spreadsheet cells. Then the pink cells automatically calculate the answ
Subjects:
Grades:
7th - 12th, Higher Education
Types:
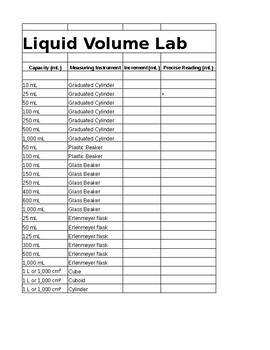
Liquid Volume Lab
using the metric system, students find the increment, estimate, and measure the actual reading in different measuring instrument. Food coloring can be added to water for better viewability
Subjects:
Grades:
5th - 12th
Types:
Showing 1-24 of 45 results

