53 results
High school graphing thematic unit plans for GATE
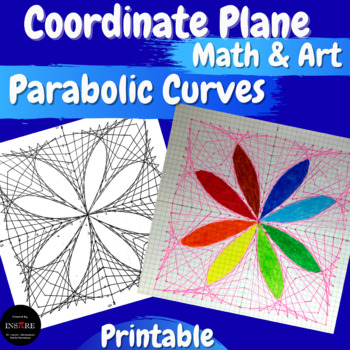
Coordinate Plane Graphing Parabolic Curves Math & Art 4 Quadrants String Art
Geometry Math Project - Practice ordered pairs plotting by using this fun activity. Make beautiful parabolic curves by drawing a series of straight lines.It's a great activity for the First Days of School, Back to School, Summer Camp, Summer School, or End of the Year.Can we draw a beautiful picture using only straight lines? Yes, we can. Check out this math & art project.Why do students love mystery picture graphing? They love discovering the next parts of the picture and guessing what it w
Subjects:
Grades:
6th - 9th
Types:

Statistics Survey Project - Project Based Learning (PBL) with Math
Watch your students dive into the world of math as they create, execute, and analyze their own survey! Students will demonstrate mastery of data gathering, survey sampling, developing appropriate survey questions, data tables, Direct Variation, discrete graphs, dot plots, box and whisker graphs, and calculating the inter-quartile range.The Unique Survey Project is highly engaging, capitalizing on the innate curiosity of the adolescent mind. You will love the low-prep instructional guide. Your st
Subjects:
Grades:
6th - 10th
Types:
Also included in: Fun with Ratios Activities Bundle - 7th Grade PBL with Math
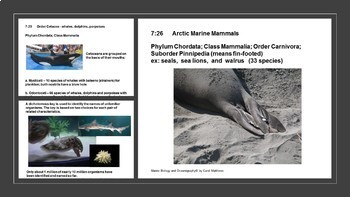
Polar Seas - Ocean/Marine Biology Unit 7
Polar Seas are unique habitats that influence climate and account for the diverse characteristics of polar animals such as Pinnipeds, Cetaceans and Penguins. They will use technology research skills, practice graphing from a computer program such as Excel, and to use photoperiods as a predictor to hemisphere location. Taxonomy is review by having students develop their own dichotomous key.Unit curriculum includes these bookmarked sections:IntroductionStudent SyllabusTeacher Pacing guideLesson Pl
Subjects:
Grades:
10th - 12th
Also included in: Marine Biology and Oceanography Full Year, 12 Unit Bundle
Function Fun, Unit 1: Patterns, T-tables, and Graphs
OVER 50 PAGES! These are the best strategies for teaching linear functions to all students. Tested in grades 4 through high school, this unit helps students develop competency with both the concepts and computations involved in functions. The multi-representational activities cover slope, y-intercept, t-tables, graphs, formulas, and visual representations of linear functions.This unit is part 1 of a four-part series and includes 17 patterns in both color and black and white versions to provide t
Workplace Math 10 Unit 4: Creating and Interpreting Graphs BUNDLE (word,pdf&d)
©Alternate Courses creates simplified curriculum including outlines, progress charts, notes, worksheets, and inquiry projects that can be used in a traditional inclusive classroom as well as for asynchronous and remote learning. Our course work meets all the learning outcomes of the new British Columbia curriculum in a simplified form for independent, self-paced work without the need for a textbook. We at ©Alternate Courses create the curriculum so that you can spend more time creating connectio
Subjects:
Grades:
10th
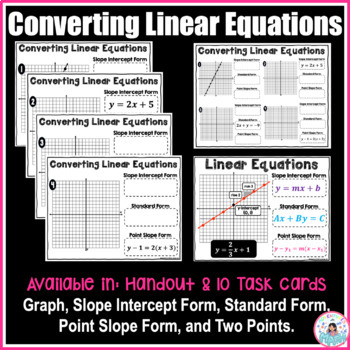
Converting Linear Equations: Slope Intercept, Standard, Point Slope, Two Points
The activity has 10 linear equations task cards. Students are only given one form in each problem (graph, slope-intercept form, standard form, point-slope form, or two points), and they are expected to determine the other forms.One version is the full-size page (one problem on one page). This can be done as task cards seated as partner work, or in small group centers.The other version is a handout, meaning there are four problems on one page. This would be great as a homework assignment after l
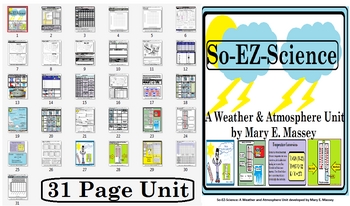
So-EZ-Science: Weather & Atmosphere Unit
This unit is a balanced literacy unit covering areas such as: temperature conversion, making a rain guage, recording weather, using weather station symbols, using the Beaufort Wind Scale, fronts, cloud types, cloud cover, graphing precipitation, graphing temperature, graphing weather phenomenon, weather tools, relative humidity, calculating relative humidity, precipitation, interpreting weather symbols on a weather map, reading a weather map, wind velocity, wind direction, wind speed, reading a
Subjects:
Grades:
3rd - 12th, Higher Education, Adult Education, Staff

Fun with Ratios Activities Bundle - 7th Grade PBL with Math
The purpose of the Fun with Ratios Activities Bundle is to give students the opportunity to use creativity to apply ratios, proportions, and percentages in real-world settings. This bundle includes three unique tasks: Black Friday Mastery Task, Direct Variation Poster Mastery Task, and the Unique Survey Project. These activities and their accompanying materials are suited for students in grades 7 through 9. These lessons make excellent sub plans. Each project takes approximately two 60-minute bl
Subjects:
Grades:
7th - 9th
Types:
Workplace Math 10 Unit 4: Creating and Interpreting Graphs BUNDLE (d)
©Alternate Courses creates simplified curriculum including outlines, progress charts, notes, worksheets, and inquiry projects that can be used in a traditional inclusive classroom as well as for asynchronous and remote learning. Our course work meets all the learning outcomes of the new British Columbia curriculum in a simplified form for independent, self-paced work without the need for a textbook. We at ©Alternate Courses create the curriculum so that you can spend more time creating connectio
Subjects:
Grades:
10th
Workplace Math 10 Unit 4: Creating and Interpreting Graphs BUNDLE
©Alternate Courses creates simplified curriculum including outlines, progress charts, notes, worksheets, tests, and inquiry projects that can be used in a traditional inclusive classroom as well as for asynchronous and remote learning. Our course work meets all the learning outcomes of the new British Columbia curriculum in a simplified form for independent, self-paced work without the need for a textbook. We at ©Alternate Courses create the curriculum so that you can spend more time creating co
Subjects:
Grades:
10th
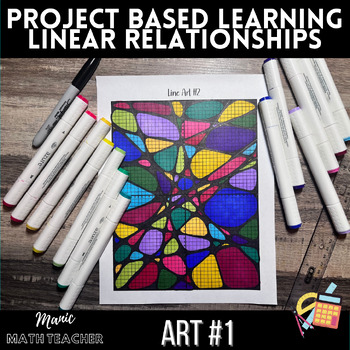
Linear Relationships Art #1 - Graphing Straight Lines - Project Based Learning
Linear Relationships Art #1 - Graphing Straight Lines - PBL, Project Based LearningThis math art project embodies the principles of project-based learning, merging mathematics with artistic expression to engage students in a multifaceted educational experience. Students will graph 18 linear equations, meticulously tracing each line then creating intricate oblong shapes within spaces created by the lines. The project culminates in a vibrant display of color as students fill in each unique shape,
Subjects:
Grades:
7th - 11th
Types:
Losing Your Marbles: Function Connections You Can See
This visual demonstration/lab helps students make complete sense of functions. Topics addressed include slope, y-intercept, rise & run, slope-intercept form, domain & range, independent & dependent variables, and line of best fit. Whole number, fractional, and positive and negative slopes are addressed.
Adaptations make the lesson accessible to both younger and more advanced students.
The download includes complete instructions, activity masters, answer keys, Common Core alignment, a
Subjects:
Grades:
6th - 9th
Types:
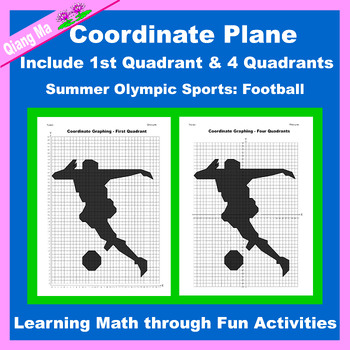
Olympic Coordinate Plane Graphing Picture: Football -Summer Sports
This coordinate plane Summer Olympics/Paralympics Sports Game graphic art would be ideal for students that are just beginning with graphing coordinates or students that need a little extra practice. It is also a great fun activity for Olympics. Use for Olympics, or any time of the year. The pictures have two different graphing options to easily provide differentiation in your classroom. Prep free! Differentiated! Independent!- One picture to be graphed in first quadrant with positive whole n
Subjects:
Grades:
4th - 12th
Types:
Also included in: Olympic Coordinate Plane Graphing Picture: Summer Olympic Sports 16 in 1
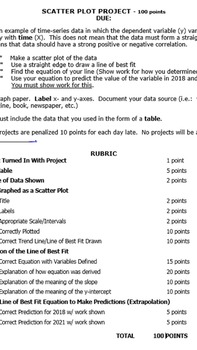
Scatterplot Project Using Real Data
Students are asked to find an example of time-series data in which the dependent variable (y) varies linearly with time (X). The data should have a strong positive or negative correlation. Students will be asked to:
Make a scatter plot of the data.
Use a straight edge to draw a line of best fit.
Find the equation of the line where they must show work for how they determined this.
Use their equation to predict the value of the variable in 2012 and 2018.
A very detailed rubric is provided. 1
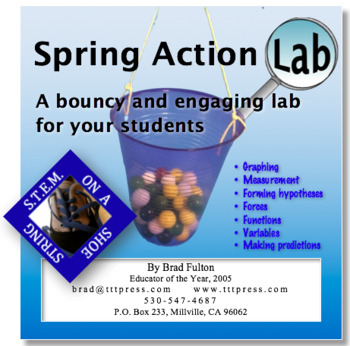
Spring Action Lab: A Bouncy and Engaging STEM Lab
Students will enjoy putting their learning to work in this engaging lab. Using springs or rubber bands, students measure and record data as they try to get a bucket to touch the floor by adding weights. Then they use their data and its graph to make predictions and write equations that will help them predict the outcomes. This simple and inexpensive lab will help your students learn graphing, t-tables, measurement, linear functions, and the physics of tension forces. This can be used as a stand-
Subjects:
Grades:
5th - 9th
Types:
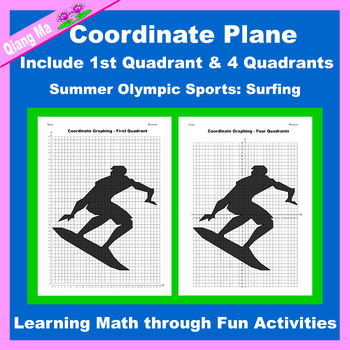
Olympic Coordinate Plane Graphing Picture: Surfing -Summer Sports
This coordinate plane Summer Olympics/Paralympics Sports Game graphic art would be ideal for students that are just beginning with graphing coordinates or students that need a little extra practice. It is also a great fun activity for Olympics. Use for Olympics, or any time of the year. The pictures have two different graphing options to easily provide differentiation in your classroom. Prep free! Differentiated! Independent!- One picture to be graphed in first quadrant with positive whole n
Subjects:
Grades:
4th - 12th
Types:
Also included in: Olympic Coordinate Plane Graphing Picture: Summer Olympic Sports 16 in 1

Linear Graphs & Coordinate Geometry - Complete Unit of Work
In this unit students will learn about the links between equations and graphs. They will plot graphs of horizontal, vertical and diagonal lines. They will learn how to find the gradient and the equation of straight line graphs, in the forms y = mx + c and ax + by = c, and they will learn the special rules for gradients of parallel and perpendicular lines.
ABOUT THIS RESOURCE PACK:
This pack is designed to provide teachers with complete lesson plans and classroom resources to teach excellent le
Subjects:
Grades:
7th - 10th
Also included in: Complete Bundle - All units of work
Catch Up: Helping Students Understand the Importance of Completing Work
If you want to reinforce the importance of doing work this is a powerful way to accomplish your goal while teaching t-tables, graphing, patterns, and functions. Students typically don’t realize how important each assignment is to the outcome of their grade. With this activity, they will see its impact and remember it for months to come. A great way to start your school year or a new grading period.
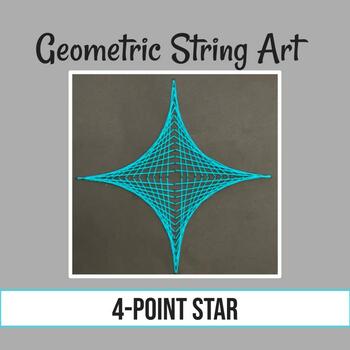
Geometric String Art: 4-Point Star
Create a beautiful 4-point star using a traditional number system for younger students or coordinates for older students. Comes with both sets of instructions, ready to print for student use! Use when teaching about symmetry, coordinate plane, cartioid, point, segment or just for fun! Includes a material list and possible modifications to use with all students.
Subjects:
Grades:
1st - 12th, Higher Education, Adult Education
Types:
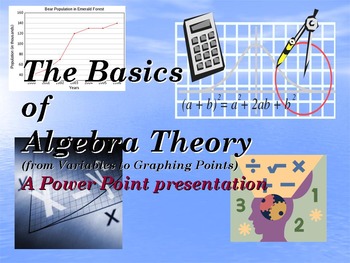
The Basics of Algebra Theory: From Variables to Graphing in Power Point
Feeling a bit OVERWHELMED and Need to Teach ALGEBRA THEORY? Then here is a power point presentation to present to your students while feeling confident in your skills. Each slide will present my style for teaching the basics of Algebra theory with my actual lecture presentations. Topics covered in this presentation are:What is a variable?Basic terminology.Evaluating an open sentence using a replacement set.Order of operation (PEMDAS).Operating on signed numbers.Combining similar terms.Solving
Grades:
4th - 12th, Adult Education, Staff
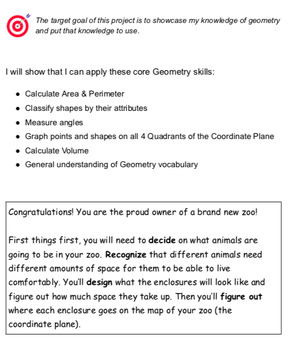
Geometry Cumulative Project Zoo, PBL Project Based Learning, Math skills
This is intended to be used towards the end of a unit, or in place of a unit test, that encapsulates all of the geometric concepts that have been taught. It involves using: area & perimetervolumesmeasuring angles with a protractorshape attributesgraphing ordered pairs on all 4 coordinate plane quadrantsusing Geometry vocabularyart...and more

"Playing the Stock Market" Cooperative Unit, Economics & Spreadsheet Skills
So they can make fiscally sound decisions as adults, students need to be taught about how money and stocks affect the economy. But it's complicated to understand and can be hard to teach.
This unique unit takes it step-by-step, scaffolding the information so that students have a comprehensive understanding of how money is made and lost in the stock market. The series of lessons teach students about investing in the stock market starting with an investigation into the various ways money can be
Grades:
6th - 9th

Similarity & Congruence - Complete Unit of Work
In this unit students will learn about congruent and similar shapes. They will start by learning a definition of congruence and understanding the conditions under which triangles can be shown to be congruent, and then using this to solve angle problems. They will then go on to look at the definition of similar shapes, how to prove that two triangles are similar and the effect of the scale factor on the area and volume of similar shapes and solids.
ABOUT THIS RESOURCE PACK:
This pack is designe
Subjects:
Grades:
7th - 10th
Also included in: Complete Bundle - All units of work
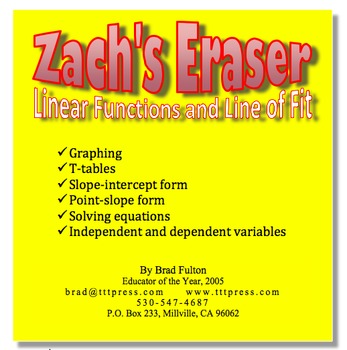
Zach's Eraser: Linear Functions and Line of Fit
This is an effective and thought-provoking way to helps students apply functions to real situations. The resulting function shows a negative slope. Though it is a simple linear function, the data is not perfect, so a line of fit must be employed. Because it is based on real data, even students who have only a beginning experience with functions can understand the concepts and mathematics. The lesson can incorporate slope-intercept and point-slope forms as well as independent and dependent variab
Subjects:
Grades:
7th - 10th
Types:
Showing 1-24 of 53 results


