3 results
Statistics resources for Google Apps and for GATE

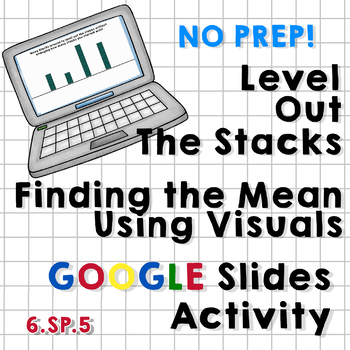
Level Out the Stacks - Finding Mean Using Visuals - Google Slides Activity
This Google Slides Activity includes 25 unique slides that help students to find the mean of a set of data using visuals first (stacks of blocks of varying heights), then eventually proving their answer by performing the actual calculations.
The slides become moderately more difficult as students progress through the activity, ending with several decimal problems where the cubes they're working with are split into fourths and the calculated mean is a decimal.
The slides are easy to duplicate
Subjects:
Grades:
5th - 7th
Types:
CCSS:

✏️ Statistics & Probability Performance Tasks
There are 4 separate performance tasks in this Google Drive Folder! You can work on them with your students, have them work in groups, or give it as an assessment! These are great problems that ensure even greater classroom conversations!
Subjects:
Grades:
6th - 8th
Types:
Also included in: ✏️ 6th Math Performance Task BUNDLE

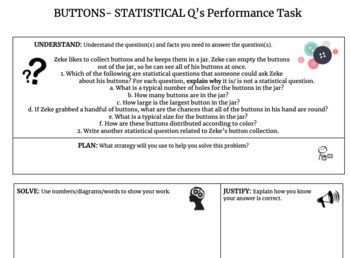
✏️ Statistics Performance Task FREEBIE!
You can work on them with your students, have them work in groups, or give it as an assessment! These are great problems that ensure even greater classroom conversations!
Subjects:
Grades:
6th - 8th
Types:
CCSS:
Showing 1-3 of 3 results


