275 results
5th grade statistics homework for GATE
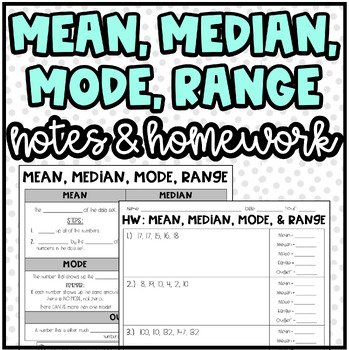
Mean, Median, Mode, Range, and Outlier | Notes and Homework or Practice
Notes & Homework: Mean, Median, Mode, Range, and Outlier:I used these notes, practice, and homework with my students. I used this lesson to serve as a "quick lesson" for the students. It covers how to find the mean, median, mode, range, and outlier.Product Includes:Notes Page with 2 examplesNotes Page Answer KeyHomework (10 organized problems with workspace provided)Homework Answer KeyThank You! ❤️I really appreciate your interest in my product! I love to create new things for my students! A
Subjects:
Grades:
5th - 8th
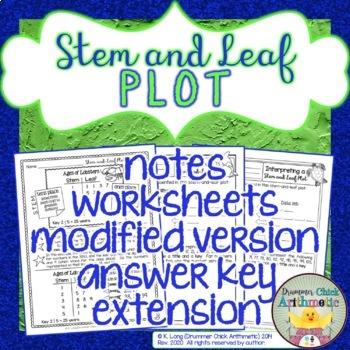
Stem and Leaf Plot Notes and Worksheets
Show your students that a stem-and-leaf plot is actually a pretty easy and fun (yes, fun!) way to organize data with these worksheets and notes based on animals' life spans. On these two worksheets, students write the data from a graph and then create a graph based on a set of data. Notes about interpreting a stem and leaf plot are included!Can I modify this for my learners?Yes! Modified versions of the worksheets are included. An extension is also included for your early finishers (students
Subjects:
Grades:
4th - 7th
Types:
Also included in: Stem and Leaf Plot Bundle
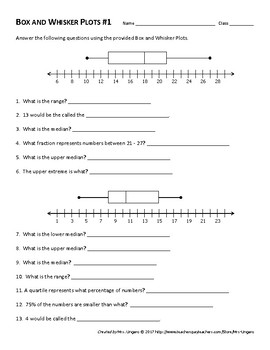
Box and Whisker Plot Worksheets
This product contains TWO Box-and-Whisker Plot worksheets.
Both worksheets requires students to read, interpret, and create Box-and-Whisker plots. Students will first be asked to find lower and upper extremes, range, and all three medians. Following this, students will be creating their own Box-and-Whisker Plots using the information provided.
Worksheet #1 is slightly easier than worksheet #2. This can be used to cover multiple days of instruction or to differentiate within the classroom.
Subjects:
Grades:
5th - 8th
Types:
CCSS:
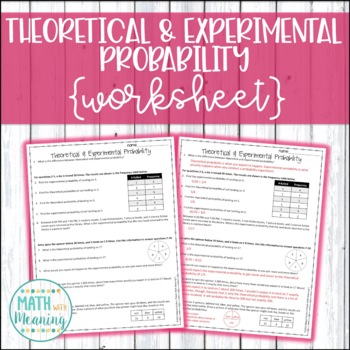
Theoretical and Experimental Probability Worksheet
This 1-page, 11-question worksheet is a great way for students to practice finding the theoretical and experimental probabilities of simple events! Please view the preview file to determine if this product is appropriate for your students!An answer key is included.This activity is aligned to CCSS 7.SP.C.6.Please note that this activity is NOT editable. The text, problems, and images are not able to be changed.***************************************************************************You May Also
Subjects:
Grades:
5th - 8th
Types:
CCSS:
Also included in: 7th Grade Math Printable Activities Mega Bundle - 50 Activities
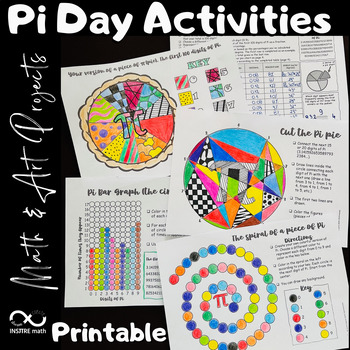
4 Pi Day Math Activities | Math & Art Projects | Coloring Circles | Pie Chart
4 Math & Art Projects to celebrate Pi Day that include circles and Pi exploration! Your students will love these Pi Day activities! Let your students express themselves using these hands-on Math & Art resources during the exploration of Pi.Content:- Your version of a piece of π (pie). The first 100 digits of Pi. Frequency Pie Chart.- Pi Bar Graph - the circular version.- The spiral of a piece of Pi.- Cut the Pi pie.This resource includes:- The editable PowerPoint™ version.- The printable
Subjects:
Grades:
4th - 8th
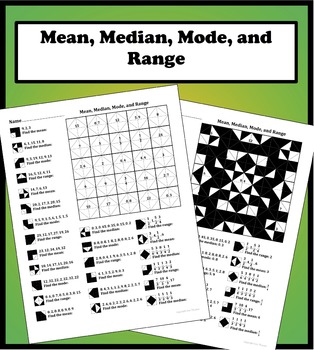
Mean, Median, Mode, and Range Color Worksheet
25 carefully thought out problems on finding the mean, median, mode, and range. The problems start off easy and slowly work their way to more difficult problems including decimals and fractions.
Each question corresponds to a matching answer that gets colored in to form a symmetrical design. Not only does this make it fun and rewarding for students but it also makes it easy for students and teachers to know if the worksheet has been completed correctly. Great for classwork, homework, addition
Subjects:
Grades:
5th - 9th
Types:
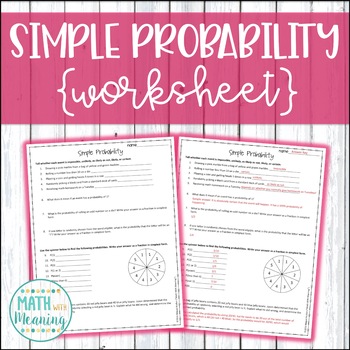
Simple Probability Worksheet - Aligned to CCSS 7.SP.C.5 and 7.SP.C.7.A
This 1-page, 17-question worksheet is a great way for students to practice finding the probability of simple events! It also includes questions that require students to decide where events would fall on the probability meter. Please view the preview file to determine if this product is appropriate for your students!An answer key is included.This activity is aligned to CCSS 7.SP.C.5 and 7.SP.C.7.A.Please note that this activity is NOT editable. The text, problems, and images are not able to be ch
Subjects:
Grades:
5th - 8th
Types:
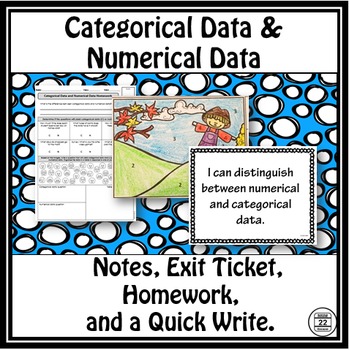
Categorical Data and Numerical Data
Are you planning an introduction to variability unit? Want a fun lesson on generating statistical questions? These categorical data and numerical data guided notes, exit ticket, homework, and writing prompt focus on distinguishing between data through word analysis and generating statistical questions.These materials will engage kids as they learn about this important math concept. Answer keys are included.
(1) Guided notes: information that gets straight to the point in easy-to-understand lang
Subjects:
Grades:
5th - 7th
Types:

Football STEM Field Goal Challenge and History of Football and The Super Bowl
Super Bowl STEM Football Challenge! Looking for something to get your kids excited about learning during football season or during Super Bowl week. Engage your students with STEM Football Challenges, it also connects to Mike Lupic's book Million-Dollar Throw! STEM Football includes football terms, history of football, STEM Challenge, and a lap book that your students will love! The lap book is a great way for students to keep themselves accountable for their reading and to help them stay on
Subjects:
Grades:
3rd - 5th
Types:
NGSS:
3-5-ETS1-1
, 3-5-ETS1-2
Also included in: STEM Novel Connections and Activities
Mean Absolute Deviation Worksheet w/ Answer Key - Grade 6 Math - Statistics
This is a grade 6 math worksheet that can be used in class or as a homework assignment. It is one worksheet from my Grade 6 Statistics Unit.
Mean absolute deviation is a new topic to the sixth grade because of the new common core. There are not many resources out there now. This is one of three worksheets I created. Other worksheets are included in my statistics unit.
Standards Addressed:
6.SP.2 Understand that a set of data collected to answer a statistical question has a distribution w
Subjects:
Grades:
5th - 7th
Types:
12 Days of Christmas: A Computer Spreadsheet Activity
This great holiday activity shows students how to use a computer spreadsheet to calculate the cost of their true love's gifts in today's dollars.The simple step-by-step procedure will allow both beginning and computer-savvy students to experience success as they learn how to use spreadsheet software. Students will enjoy the engaging and entertaining activity. No computer? No problem! Use the activity master so students can calculate the costs themselves.
Grades:
5th - 9th
Types:
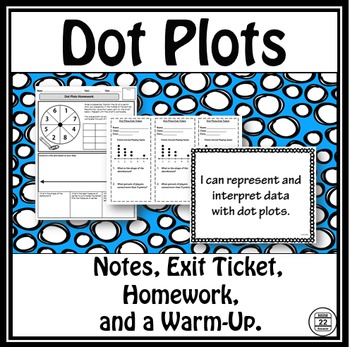
Dot Plots Lesson
These notes on dot plots include tools you can use for an introductory lesson. It includes guided dot plot notes, an exit ticket, homework, and a quick write. These materials will engage kids as they learn about this important math concept. Answer keys are included.
(1) Guided notes: information that gets straight to the point in easy-to-understand language and visuals.
(2) Exit ticket: small, but effective tool to assess student learning.
(3) Homework: reinforce the lesson at home.
(4) Qui
Subjects:
Grades:
5th - 7th
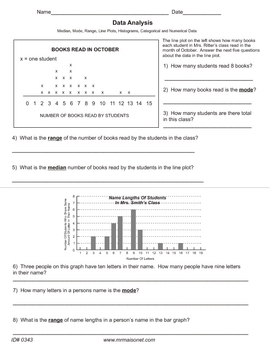
Mean, Median, mode And Range Practice Packet
This packet provides practice working with measures of central tendency. Practice interpreting line plots and histograms and answer story problems.
This work is licensed under a Creative Commons Attribution-NonCommercial-NoDerivs 3.0 Unported License.
Subjects:
Grades:
5th - 7th
Types:
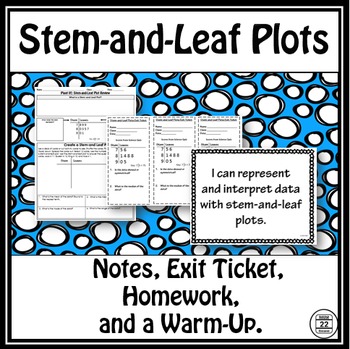
Stem and Leaf Plots Lesson
These pages include tools you can use for an introductory lesson on stem-and-leaf plots. It includes guided notes, an exit ticket, homework, and a quick write. These materials will engage kids as they learn about this important math concept. Answer keys are included.
(1) Guided notes: information that gets straight to the point in easy-to-understand language and visuals.
(2) Exit ticket: small, but effective tool to assess student learning.
(3) Homework: reinforce the lesson at home.
(4) Qu
Subjects:
Grades:
5th - 7th
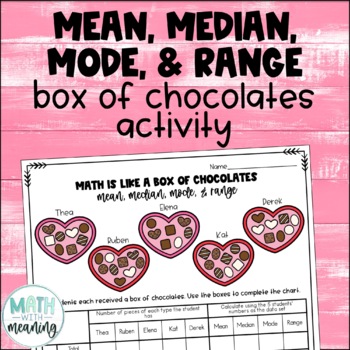
Valentine's Day Mean Median Mode and Range Activity Box of Chocolates Statistics
Math is like a box of chocolates! Looking for a fun Valentine's Day activity for practicing measures of center and variability? Students will practice calculating mean, median, mode, and range with this no-prep activity. Students will use the included box of chocolates image to create 10 sets of data and calculate the mean, median, mode, and range for each of them. They will then draw some conclusions from the data.Please view the preview file to make sure that this activity is appropriate for y
Subjects:
Grades:
5th - 8th
Types:
CCSS:
Also included in: Valentine's Day Math Activities for Middle School Math
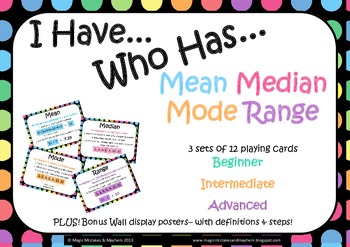
Mean, Median, Mode, Range "I Have Who Has" Game
A GREAT, FUN WAY FOR KIDS TO PRACTICE AND REINFORCE THEIR SKILLS IN THIS TRICKY TO REMEMBER AREA!3 DIFFERENT LEVELS! This pack includes 36 cards for the game "I Have Who Has" with a focus on Mean, Median, Mode and Range. The cards are split into three levels to be played in small groupsBeginner (green cards)Intermediate (orange cards)Advanced (purple cards)The aim of the game is to quickly work out the problem on your card so that when some one asks "who has...." if it is you then you can answe
Subjects:
Grades:
4th - 7th
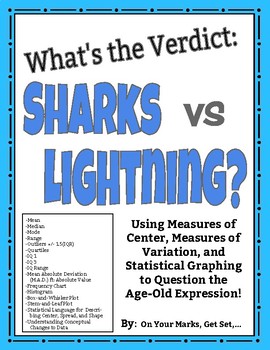
What's the Verdict: Sharks vs. Lightning? Modes of Center, Spread, and More!
Put it to the test! Use the age-old expression: "You are more likely to get struck by lightning than to be bitten by a shark!" to learn and practice Measures of Center, Measures of Spread, Measures of Shape, and Statistical Graphing including:MEANMEDIANMODERANGEOUTLIERS [Using IQR +/- 1.5(IQR)]QUARTILES [lower quartile (IQ-1) and upper quartile (IQ-3)]INTERQUARTILE RANGE (IQR)MEAN ABSOLUTE DEVIATION/ M.A.D. ft. ABSOLUTE VALUESYMMETRY/ASYMMETRY OF DISTRIBUTIONCLUSTERS AND GAPSBELL SHAPED CURVE AN
Subjects:
Grades:
5th - 12th, Higher Education, Adult Education
Types:
March Madness Math Statistics Activity
Students will choose their own team in the March Madness tournament and find the data landmarks for the points that team scored throughout the year. Students will also be asked to create a histogram using the points the team scored throughout the year.
*One modification - If you prefer you can give your students a few teams to pick from instead of allowing them to choose ANY team.
Subjects:
Grades:
5th - 12th
Types:
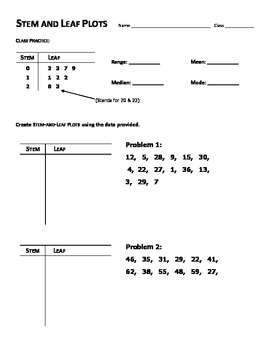
Stem and Leaf Plots Worksheet
This worksheet focuses on creating, reading, and interpreting Stem-and-Leaf Plots.
After class practice, students make two Stem-and-Leaf Plots. Following this, students must use two additional plots to find mean, median, mode, and range. This will also explore how changes made to the plots may or may not impact these averages.
This work is licensed under a Creative Commons Attribution-NonCommercial-NoDerivs 3.0 Unported License.
Subjects:
Grades:
5th - 8th
Types:
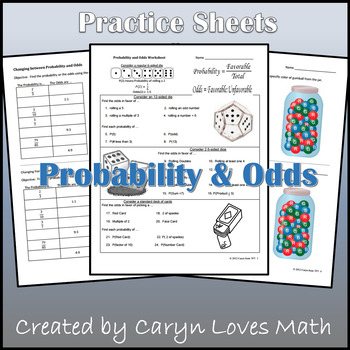
Finding Probability & Odds~Changing Between~Worksheets~Handout
This product includes 4 worksheets with keys
2 Worksheets have students find the probability or odds of an event happening using dices, cards and jar of gumballs.
2 worksheets have students practice finding the odds given the probability or finding the probability given the odds.
Also included is a deck of card handout to help student that do not know the suites or which cards are red and black, etc.
Subjects:
Grades:
5th - 11th
Types:
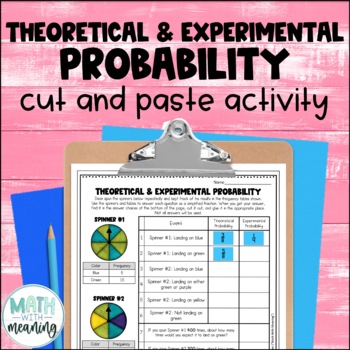
Theoretical and Experimental Probability Cut and Paste Worksheet Activity
Looking for a fun way to practice with theoretical and experimental probability? Students will use two sets of spinners and frequency tables to answer questions in this fun cut and paste activity!This activity requires students to find the theoretical and experimental probabilities of simple events and to use theoretical probabilities to make predictions. Please view the preview file to make sure that this activity is appropriate for your students.There are 2 versions of this activity included.
Subjects:
Grades:
5th - 8th
Types:
CCSS:
Also included in: 7th Grade Math Printable Activities Mega Bundle - 50 Activities
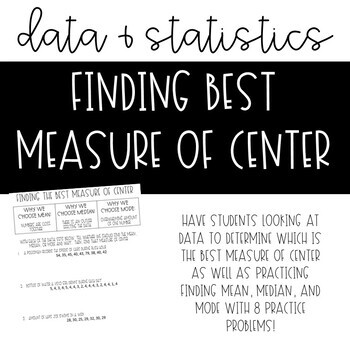
Finding Best Measure of Center *NO PREP*
In this 8 problem worksheet, students will look at a set of data and determine whether they need to use the mean, median, or mode as the best measure of center. The worksheet comes with an explanation of how a student would determine which is the better measure so there is no prep for the teacher! Use this in centers, for sub plans, or as a homework assignment.
Subjects:
Grades:
4th - 8th
Analyzing a Frequency Table - Mean, Median, Mode, Range, Outlier
This product will help your students discover how outliers affect the measures of central tendency and range. By making calculations and analyzing data, students make conjectures and justify them in writing using mathematical reasoning and evidence.
What is included?
This product contains 2 student work pages centered around a set of data presented in a frequency table. The data includes an outlier. Students are required to calculate mean, median, mode, and range from each data display. Stu
Subjects:
Grades:
5th - 10th
Types:
6th Grade Common Core Math Targeted Assessments MEGA Bundle
Targeted Assessments are designed to give you the data you need about your students understanding of each indicator in all FIVE Common Core Standards for 6th Grade! Our questions that have been carefully crafted to ensure you fully assess each indicator!We have also included the answer keys AND a tracking sheets to help you make sense of the amazing amount of data you will be collecting from these assessment pages.Our Targeted Assessment sets also make the perfect homework or extension activitie
Subjects:
Grades:
5th - 8th
Types:
Showing 1-24 of 275 results


