7 results
Geography Common Core 7.SP.B.4 resources for early intervention
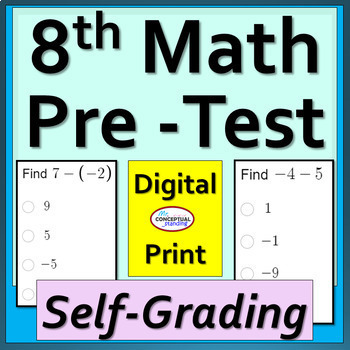
Beginning of Year 8th Grade Math Pre Assessment Pretest Self Grading & Print Too
This self-scoring digital assessment is a Back to School 8th Grade Pre-Assessment, 8th Grade Math Pre-Test, 8th Grade Math Pre-Diagnostic Test, 8th Grade Math Assessment, 8th Grade Baseline, Intervention or a 8th Grade Math Readiness Test. It is for Distance Learning or In-Person. Perfect for Google Classroom, this useful assessment covers ONLY 7th Grade Common Core Math standards. Print version: Microsoft Word Document and PDF versions included. ZIP Extractor may be required, a free app for ope
Subjects:
Grades:
7th - 8th
Types:

Back to School Beginning of the Year 8th Grade Math DIGITAL Escape Room Activity
In this 8th Grade Math back to school activity, students work on a spiral review of problems aligned with the critical areas of the 7th Grade Standards. Use this for beginning of the year review, first day of school, group work or independent practice, first week of school, emergency sub plans or any time to review. Not all standards are addressed though because it would be too long. The codes (answer key) for each lock are provided! The bonus lock/level at the end is optional for the sake of ti
Subjects:
Grades:
7th - 9th
Types:
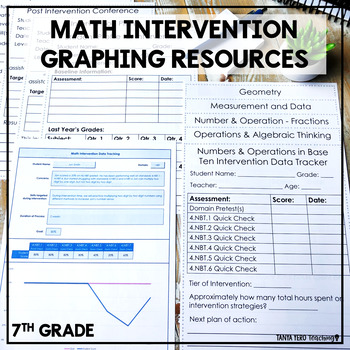
7th Grade RTI Documentation Forms | Math Intervention Tracking Sheets
Everything you need to track student progress and keep you RTI efforts organized! This file includes printable graphs and recording sheets for every step of the math intervention process. This resource pairs perfectly with our 7th Math Intervention Bundle.Use these forms to track RTI progress and provide documentation for parents and administration. There is a breakdown of how to use each form and tips and suggestions for filling each sheet out. There is also a digital option for tracking the in
Subjects:
Grades:
7th - 8th
Types:
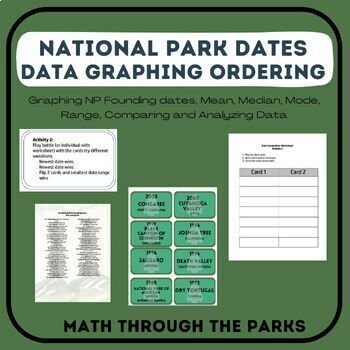
US National Park Founding Dates Graphing and Analyzing Data
Math is everywhere. This activity takes us into the founding dates of the US National Parks. The students will graph and analyze data of the dates. This includes multiple activities that can be use in various environments in the classroom. This activity includes the following concepts.· Order sets of real numbers arising in mathematical real-world contexts· Extent previous knowledge of sets and subsets using the visual representation to describe relationships between sets of real numbers.· MMMR
Subjects:
Grades:
6th - 8th
Types:
7th Grade Statistics and Probabilities IEP goals
Do you feel frustrated and overwhelmed with everything on your plate? No need to sweat the small stuff. Relieve your current and future headaches with these premade IEP goals. There is no mixing and matching needed. This premade 7th Grade Statistics and Probabilities IEP goals packet is designed to save you valuable time, frustration, and headaches. Simply fill in the bold information to personalize each goal. This 7th Grade Statistics and Probabilities IEP goals packet is aligned with Common Co
Subjects:
Grades:
7th
Types:
Also included in: 7th Grade Math IEP goals bundle
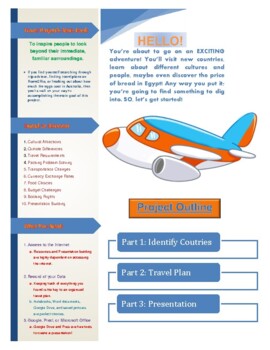
World Travel Presentation: Geography, Economics, ELA Distance Learning Project
***PLEASE REVIEW THIS PRODUCT*** Are you ready for your biggest adventure yet?This product includes:Instructor and student guided lesson planTravel project outlineSpecific resourcesWebsite directional instructions Custom graphic organizer printable templatesPrezi account instructionsIntegrated subject learning: Geography, Economics, Mathematics, English, History, Technology, HealthDeep learning, real world considerationsBudgeting practice Creative writing story promptUse this product again and a
Subjects:
Grades:
4th - 12th
Types:
Data Analysis Unit Project
Students will be assigned a city from a region in the Middle East, Southern and Eastern Asia, or Africa (7th Grade Georgia Social Studies) and will compile information to create a poster to present the data analysis of their city. I used this in conjunction with a Language Arts unit centered around the novel The Cay. Students compared their city's temperature to Willemstad, Curacao. Project includes box and whisker plots, measures of central tendency, double line graph. Students also investi
Subjects:
Grades:
6th - 8th
Types:
Showing 1-7 of 7 results

