US National Park Founding Dates Graphing and Analyzing Data
- PDF
Description
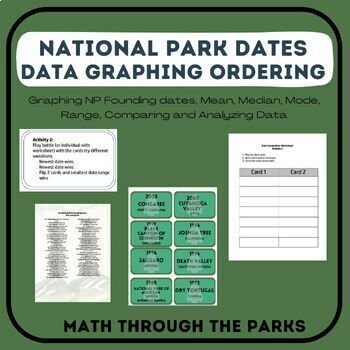
Math is everywhere. This activity takes us into the founding dates of the US National Parks. The students will graph and analyze data of the dates. This includes multiple activities that can be use in various environments in the classroom.
This activity includes the following concepts.
· Order sets of real numbers arising in mathematical real-world contexts
· Extent previous knowledge of sets and subsets using the visual representation to describe relationships between sets of real numbers.
· MMMR IQR
· Represent numerical data graphically.
· Summarize categorical data with numerical and graphical summaries as well as percents.
· Solve problems using data represented in bar graphs, dot plots, and circle graphs, including part-to-whole and part-to part comparisons and equivalents.
· Compare two groups of numeric data using comparative dot plots or box plots by comparing their shapes, centers, and spreads.
There are multiple lessons that can be taught using the national park date cards. I recommend printing a set per group on cardstock paper. These can be used for many activities in this bundle. On the next two pages I also have the National Parks in order alphabetically and by founding date for your reference.
Activities Include:
· Graphing National Parks by date
- Option 1 Have students plot all 63 parks and do questions
- Have a copy of the parks printed in Alphabetical other. The parks by date are for your reference and help with grading.
- Another option is to use the national park cards for graphing instead.
- Option 1 Have students plot all 63 parks and do questions
- Option 2 Split the park dates into 2 groups (at the 1960s) and have each group answer the questions based on their data.
- After doing this, have the two groups meet together and compare results and answer comparison questions.
- Option 2 Split the park dates into 2 groups (at the 1960s) and have each group answer the questions based on their data.
o Includes questions based on the data collected.
o Opportunities to collaborate as a group
· Graphing National Parks by state
o Includes questions based on the data collected.
Additional 4 activity cards with worksheets are included for additional learning.


