19 results
10th grade statistics resources for SMART Notebook and for early intervention
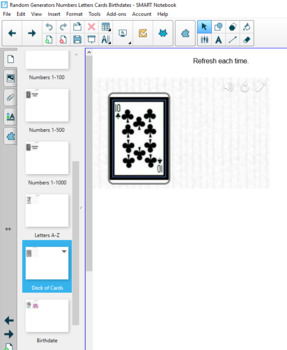
Random Number Letter Deck of Cards Birthday Generator SMART 18 Flash Replacement
If your district has upgraded to Windows 10 and SMART 18, then many of your highly-used flash components will no longer work. I have been recreating them in the new SMART 18. These Random Generators (Numbers 1-36, Numbers 1-100, Numbers 1-500, Numbers 1-1000, Letters A-Z, Playing Card from a Deck of Cards, & Birthdate) are comparable to what was previously available in SMART, though they operate differently.Random Generators SMART 18 Flash Replacement by Brian Tillmann is licensed under a Cr
Subjects:
Grades:
K - 12th, Staff
Types:
Margin of Error Lesson | SMART Board File
The file attached is an interactive SMART Board file that focuses on the topic of Margin of Error. Use this resource to help you navigate through the Common Core Algebra 2 Statistics unit. This lesson adheres to the Common Core State Standards.Structure of lesson: Aim (Objective), Do Now (Warm up), Development (Definitions/ Diagrams), Practice Questions (including Regents Questions), Summary Questions (which can be used as an Exit Ticket).Material Covered: All three formulas and when to use them
Subjects:
Grades:
9th - 12th
Types:
SMARTBOARD lesson on ratios, fractions, percentages, and more
This smartboard lesson showcases how ratios, fractions, decimals, probabilities, and percentages are all similar ways of looking at the same thing. Each page has a spinner with a different amount of colored slices on it. As you go from many slices to fewer slices, the chance of correctly predicting what color comes up gets much better.
Have students 'bet' classroom rewards like tickets or candy to see who can correctly guess the most colors as you go through the lesson.
Subjects:
Grades:
3rd - 12th, Adult Education

GRAPHING CALCULATOR SKILLS FOR ALGEBRA
This game-like approach to learning how to use the graphing calculator for Algebra skills was a big hit with my students. It served as a great resource to review Statistic concepts such as determining mean, standard deviation, correlation coefficient, interquartile range, along with creating linear, quadratic, and exponential equations from a table on the graphing calculator.
Subjects:
Grades:
8th - 10th
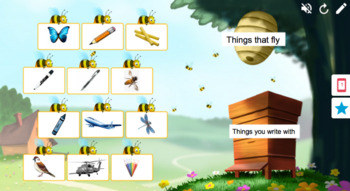
ABLLS-R B17 SmartBoard sorting activity - Distance learning
Interactive Smart Notebook matching activity for the ABLLS-R assessment section B17: Sort by functionIncludes 2 sorting games
Grades:
PreK - 12th
Types:
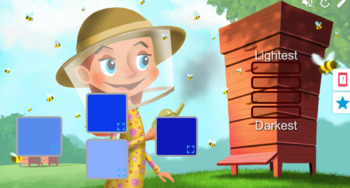
ABLLS-R B25 SmartBoard activity - Distance learning
Interactive Smart Notebook matching activity for the ABLLS-R assessment section B25: SeriationIncludes 5 rank by order games
Grades:
PreK - 12th
Types:
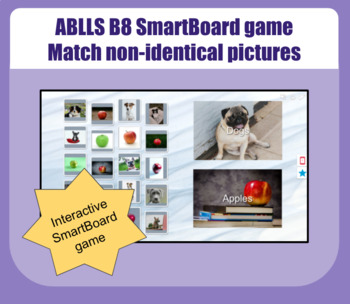
ABLLS-R B8 Smartboard sorting game - Distance learning
Smartboard game that can be used to practice skills assessed in the ABLLS-R section B8: Sort non-identical pictures
Grades:
PreK - 12th
Types:
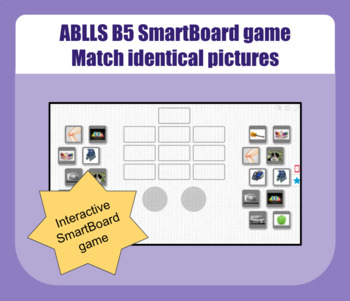
ABLLS-R B5 SmartBoard matching activity - Distance learning
Interactive Smart Notebook matching activity for the ABLLS-R assessment section B5: match identical picture to sample
Grades:
PreK - 12th
Types:
Also included in: ABLLS-R B5 Bundle! - Distance learning
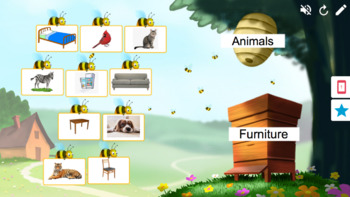
ABLLS-R B19 SmartBoard sorting activity - Distance learning
Interactive Smart Notebook matching activity for the ABLLS-R assessment section B19: Sort by class.Includes 2 matching games
Grades:
PreK - 12th
Types:
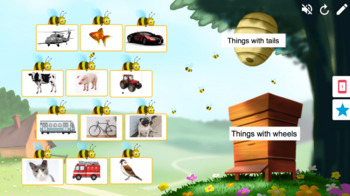
ABLLS-R B18 SmartBoard sorting activity - Distance learning
Interactive Smart Notebook matching activity for the ABLLS-R assessment section B18: Sort by feature.Includes 2 matching games
Grades:
PreK - 12th
Types:
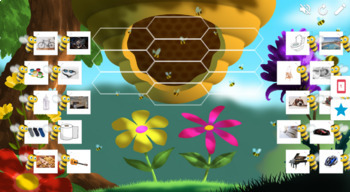
ABLLS-R B16 SmartBoard matching activity - Distance learning
Interactive Smart Notebook matching activity for the ABLLS-R assessment section B16: Match associated itemsIncludes 2 matching games
Grades:
PreK - 12th
Types:

1.1 Inferential and Descriptive Statistics
Smart Board Lesson for Bluman "Elementary Statistics) 8th edition
Subjects:
Grades:
9th - 12th
Types:

Always, Sometimes, Never Sets Smart Notebook
This is a SmartNotebook document for notes on Always, Sometimes, Never Sets. It is editable.
Subjects:
Grades:
7th - 11th

CaHSEE Data Stats and Probability
Works through CaHSEE standards for Data, Statistics and Probability. Finding Mean, Median, and Mode. Working with dependent and independent probabilities. Guided and Independent practice included.
Subjects:
Grades:
8th - 11th
Types:

1.2-1.4 Data Sampling and Techniques
Smart Board Lesson for Bluman "Elementary Statistics" 8th edition
Subjects:
Grades:
9th - 12th
Types:
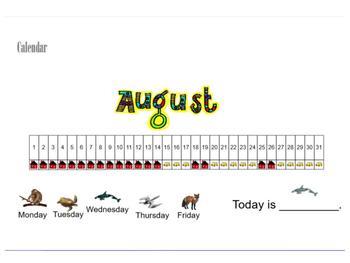
Smart Notebook Early Education Circle Time
Includes attendance, linear calendar (for August 2018 only, updated months to come), weather graph, freeze dance, and a message of the day page.
Designed for a blended special education preschool classroom, but can be used and adapted for a wide range of learners.
Grades:
PreK - 12th
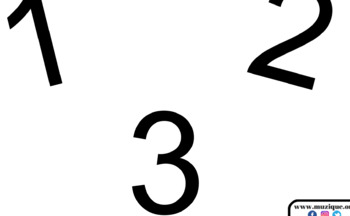
123 Numbers Clickable Slideshow- Smartboard/Kooshball
Simple 4 slide presentation with numbers 1, 2, and 3! Clickable to use with Kooshball or letting students choose! Can add or change slides to make each number an item for a task or activity or just to teach basic numbers!
Subjects:
Grades:
PreK - 12th, Higher Education, Adult Education
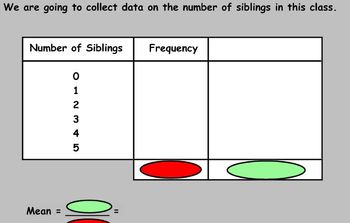
SmartNotebook Lesson - Calculating averages from a table
This notebook file can be used as an entire lesson to teach calculating averages from a table.
The first slide contains a starter asking students to find the mean, median and mode from sets of data. The second slide can be used to collect your own data in the class in order to show how to calculate the mean.
Following that there is another example, before finally showing two questions on the same slide which the students can work through.
Subjects:
Grades:
6th - 11th, Higher Education
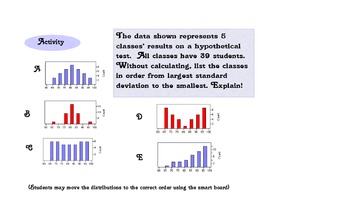
Showing 1-19 of 19 results

