33 results
7th grade graphing resources for SMART Notebook $5-10
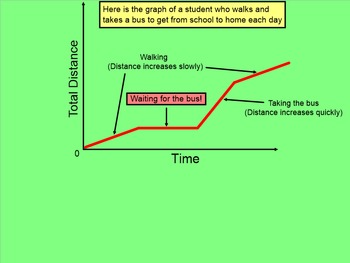
How I Teach Relating Graphs To Events
This is a 25 page Smartboard file describing how to graph situation on a coordinate graph according to different events. The lesson describes what situations make a line go up, go down, or stay horizontal. Sometimes the students have to graph the situation and sometimes the students have to write a story that matches a given graph. I also have a worksheet that goes with this.
Subjects:
Grades:
6th - 9th
Types:
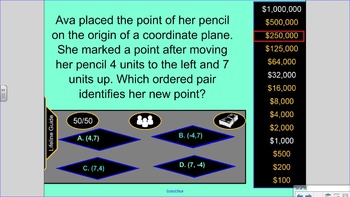
Who Wants to be a Millionaire 6th Grade Math Review VA SOL 6.3, 6.10, 6.12, 6.11
Who Wants to be a Millionaire 6th Grade Math Review VA SOL 6.3, 6.10, 6.12, 6.11. Contains 2 rounds.
SOL 6.3- Integers and Absolute Value
SOL 6.10- Area, Perimeter, and Circumference
SOL 6.12- Quadrilaterals
SOL 6.11- Coordinate Planes
Grades:
6th - 8th
Types:
Also included in: Math 6 Virginia SOL Review Games Bundle (old standards)
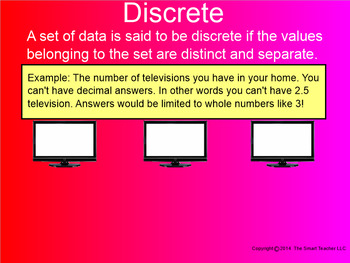
How I Teach Discrete or Continuous Graphs
This is a 33 page Smartboard file explaining the difference between Discrete and Continuous. Students learn that Discrete data is counted and that Continuous data is measured. Students practice by seeing short situations and by looking at the coordinate plane. There are many examples with answers.
Subjects:
Grades:
7th - 10th
Types:
How I Teach Slope Part 2
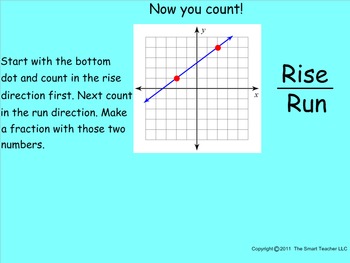
This is a 40 page Smartboard lesson covering slope. This lesson picks up where part 1 leaves off. The student learns to use rise over run to build answers according to a graphed line. The first several answers already have 2 points plotted for the students. The lesson then progresses to where the students have to plot 2 points on their own. the points are off to the side and the teacher can have students come up to the board for some interaction. All pages include answers.
Grades:
7th - 10th
Types:
How I Teach Linear and Nonlinear Functions
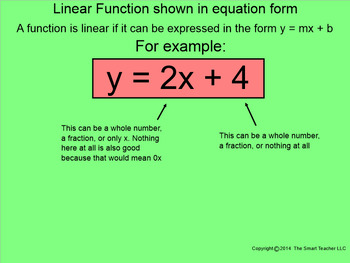
This is a 33 page Smartboard lesson explaining how to identify functions as linear and nonlinear. Students see 3 different types of functions. Functions as equations, functions graphically, and functions in a table. All have various types and styles and all examples have answers.
Subjects:
Grades:
7th - 10th
Types:
How I Teach Slope Part 4
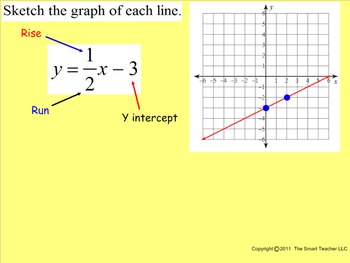
This is a 48 page Smartboard lesson on how to graph linear equations. All types of linear equations are explained here. There are slopes that are fractions and slopes that are whole numbers. Sometimes the y intercept is missing and other times there is zero slope. There are plenty examples to work with and all contain the answer. Students have a graph and a dot so that they are able to plot a couple of points and then connect them to graph the linear equation.
Grades:
7th - 10th, Higher Education
Types:
How I Teach Writing Inequalities
This is a 31 page Smartboard file teaching students how to write inequalities. The lesson begins with a review of the inequality symbols and what they mean. The lesson progresses into how to look at a graph and write an inequality that matches it. There are plenty of practice pages that include answers.
Grades:
7th - 10th
Types:
How I Teach the Coordinate Plane
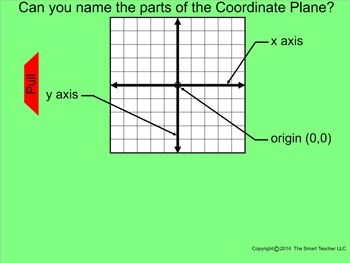
This is a 36 page Smartboard file over the Coordinate Plane. This lesson starts by explaining the parts of the coordinate plane. This would include the two axis lines and the origin. The lesson names the quadrants and shows the sign of ordered pairs in each quadrant. There is lots of practice plotting points and naming quadrants. All practice pages include answers.
Subjects:
Grades:
5th - 8th
Types:

How I Teach Scatter Plots (Line of Best Fit)
This is a 30 page Smartboard file over scatter plots. The lesson describes positive, negative, and no correlation. Students have plenty of practice looking at graphs of ordered pairs and trying to determine the line of best fit. Each practice page includes answers.
Grades:
7th - 10th
Types:
How I Teach Set Theory (Unions, Intersections, and Complements)
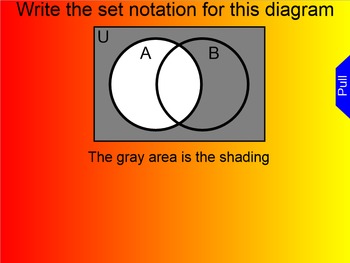
This is a 55 page Smartboard file over Set Theory. The 3 topics I'm focusing on are Union, Intersections, and Complements while reading a Venn Diagram. The lesson gives easy to understand definitions along with visuals. There are 2 and 3 circle diagrams. Sometimes students look at the diagram and read it and other times students look at and answer and write the set theory that matches what the graph is showing. There are plenty examples with answers.
Grades:
7th - 10th
Types:
How I Teach Slope Part 1
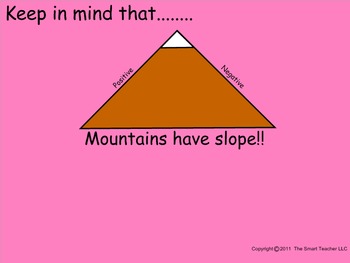
This is a 28 page Smartboard file explaining the beginning basics of finding the slope of a line. The students learn about positive slope, negative slope, zero slope, and an undefined line. One the four have been explained there is several pages of practice looking at a graph and deciding between positive, negative, zero, and undefined.
Grades:
7th - 10th
Types:
How I Teach Slope Part 3
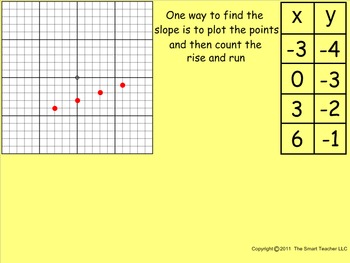
This is a 28 page Smartboard file on how to find the slope of an x and y table. The lesson explains how you can plot the points to find the slope or you can use the change in y over change in x (rise over run) formula. Each practice page has a coordinate plate to help. There are plenty of practice pages and all include answers.
Grades:
7th - 10th, Higher Education
Types:
How I Teach Graphing Using X and Y Intercepts
This is a 31 page Smartboard file over how to graph linear equations using x and y intercepts. The lesson explains what it means to be in standard form. Next the lesson has the students fill out an x-y table and plot the points. The last examples are when the intercepts are not whole numbers. There are plenty of practice pages with answers included.
Subjects:
Grades:
7th - 10th
Types:
How I Teach Box and Whisker Plots
This is a 36 page Smartboard file covering Box and Whisker plots. Students learn about upper and lower quartiles, minimum and maximum, and finding medians. The lesson leads the students through the process one step at a time. There are plenty of practice pages that all include answers.
Grades:
6th - 9th, Staff
Types:

How I Teach Inequalities Vocabulary
This is a 28 page Smartboard file helping students to learn the vocabulary that goes along with real-world inequalities. To help students solve and graph inequalities they need to understand the vocabulary that goes along with it. This lesson includes maximum, no more than, exceeds, at or below, just to mention a few. Students first try to pick the symbol without help then they are given the vocabulary in a real-life situation to help them figure it out.
Subjects:
Grades:
7th - 10th
Types:
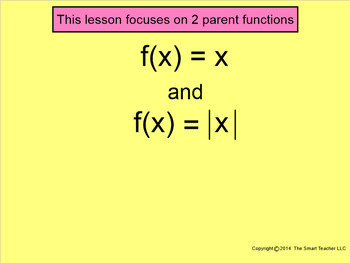
How I Teach Parent Functions and their Transformations
This is a 35 page Smartboard file on 2 Parent Functions and their transformations. The two parent functions in this lesson are linear equations and absolute value equations. The lesson explains shifting up, down, left, and right with examples and then there are a few that have a double move like 5 to the right and 3 down.
Subjects:
Grades:
7th - 10th
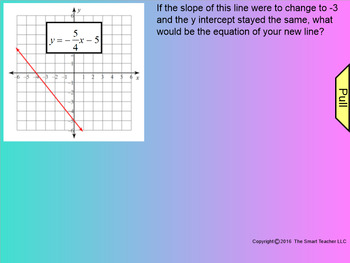
How I Teach Changing the Slope or "Y" Intercept
This is a 28 page Smartboard file about slope and y intercept changes. Students look at a graphed line before finding out if the slope or "Y" intercept gets changed. Then they have to decide what the new line will look like. If you want to know how well your students know y = mx + b this lesson will do it!
Grades:
7th - 10th
How I Teach the Midpoint Formula
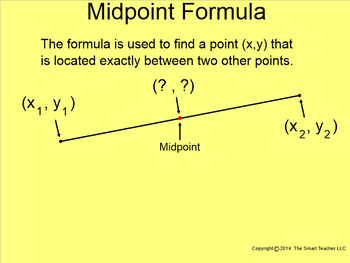
This is a 41 page Smartboard file teaching the midpoint formula. Students learn the formula and how to use it to find the midpoint of a line. After several pages of practice the lesson then explains how to find one of the endpoints if the midpoint and the other endpoint is given.
Grades:
7th - 10th
How I Teach Scatter Plots
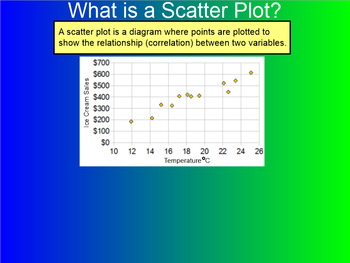
This is a 28 page Smartboard file where students learn about correlation and line of best fit. After practicing identifying positive, negative, and no correlation the lesson has students look at line of best fit and make predictions accordingly.
Subjects:
Grades:
7th - 10th
Types:
How I Teach Comparing and Ordering Integers
This is a 31 page Smartboard lesson on how to compare and order integers. The lesson starts by explaining what integers are. Next the students identify different locations on a number line (including negatives). The students learn how to order integers from least to greatest and compare integers using >, <, and =. Students also practice writing integers looking at phrases like less, loss, debt, etc. There is a little bit of everything when it comes to comparing integers. Students will love
Grades:
6th - 9th
Types:
How I Review Slope
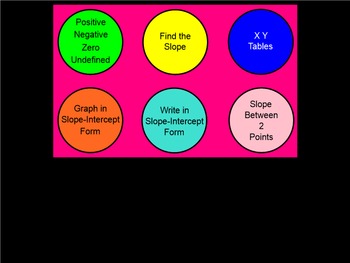
This is a 42 page Smartboard file over slope. Just about anything about slope can be reviewed here. There is review over graphing, writing the equation, finding the slope between points, deciding between positive, and negative slope and more. All practice pages come with answers.
Subjects:
Grades:
7th - 10th, Higher Education, Adult Education
Types:
How I Teach Equivalent Linear Equations
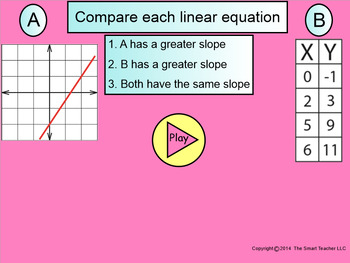
This is a 20 page Smartboard file where students compare linear equaions to decide if slope 1 is greater, slope 2 is greater, or if both slopes are the same. The equations come in 3 different forms. Sometimes it is a graphed line, sometimes it is an x y table, and sometimes it is an equation written in slope-intercept form.
Grades:
7th - 10th
Types:
How I Teach Graphing Linear Equations Using an X-Y Table
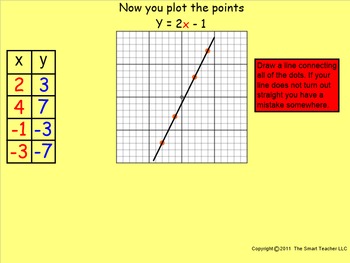
This is a 30 page Smartboard file teaching students how to graph linear equations from an x-y table. The lesson describes how any random points can be chosen and then you plug them into a function rule. Once the table is complete students plot the points to form a straight line. There is plenty of practice including answers.
Grades:
7th - 10th
Types:
How I Teach Stem & Leaf Plots
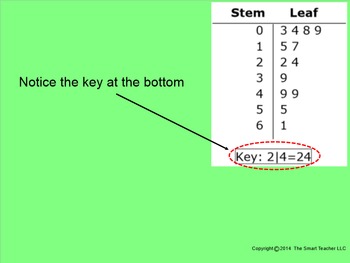
This is a 31 page Smartboard file on how to read and make stem and leaf plots. The lesson explains what makes a stem and what makes a leaf. Explanation follows on how to look at a graph and write the numbers, how to look at the numbers and make the graph, how to look at the graph and identify the mean, median, mode, and range. There are lots of practice pages with answers.
Grades:
6th - 9th
Types:
Showing 1-24 of 33 results


