19 results
St. Patrick's Day place value Common Core 6.SP.B.5 resources
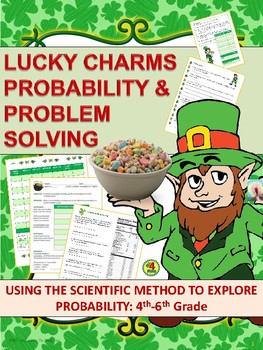
St. Patrick's Day Probability & Problem Solving with Lucky Charms:
My students LOVE this St. Patrick’s Day activity! It is set up as a lab, using the scientific method to explore the probability of eating specific marshmallows in Lucky Charms and to use the cereal's nutritional facts for further problem solving. A bar graph activity & rubric is also included, which you can use as an extension activity or extra credit.Includes:~ Student Data Chart~ Class Data Chart~ Conclusion Data Analysis Problems~ Lucky Charms Word Problems~ 2 Class's Sample Data ~ Bar G
Subjects:
Grades:
4th - 6th
Types:
Data Analysis & Probability - Task & Drill Sheets Gr. 6-8 - Distance Learning
Find out how analyzing data and understanding charts can be used in daily life. Our resource introduces the mathematical concepts taken from real-life experiences, and provides warm-up and timed practice questions to strengthen procedural proficiency skills. The task and drill sheets provide a leveled approach to learning, starting with grade 6 and increasing in difficulty to grade 8.About this Resource:Examine fundraising amounts by finding the mean, median and mode. Calculate the probability
Subjects:
Grades:
6th - 8th
Types:
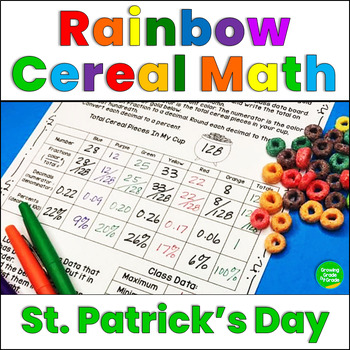
Fraction & Percent Project | St. Patrick's Day
Bring the St. Patrick's Day math fun with a real-life application of their math skills! Students sort cereal pieces by color and record the number of each color on the chart. They create fractions, decimals, and percents from their numbers. Then, they display their own data and class data on different graphs!This quick and easy project is perfect for 6th & 7th graders who work with fractions and percents. Even 5th graders will love the challenge! You'll have so many great math discussions wi
Subjects:
Grades:
5th - 7th
Types:
Data Analysis & Probability - Drill Sheets Gr. 6-8
Fully comprehend data displayed in charts by converting information into percents, ratios and fractions. Our resource provides warm-up and timed drill activities to practice procedural proficiency skills. The drill sheets provide a leveled approach to learning, starting with grade 6 and increasing in difficulty to grade 8.About this Resource:Distinguish information provided in a triple bar chart from a survey of three classrooms. Graph the results of a 5 mile (8 km) race using a graphing progra
Subjects:
Grades:
6th - 8th
Types:
Also included in: Five Strands of Math - Drills BIG BOOK - BUNDLE Gr. 6-8
Stem and Leaf Plots Smartboard Slides Lesson Stem & Leaf Plot Displaying Data
Math Teachers ~ You'll LOVE this FABULOUS Stem-and-Leaf-Plots Smartboard-Slides-Lesson has 25 slides ~providing a super, thorough lesson on Stem-and-Leaf Plots. Explains, Tells How to Create them, How to read them, and how to find the mean, median, mode, and range from them. Students will enjoy the easy to understand teaching strategies, along with the great interactive practice provided. You'll use this year after year to teach Stem -n-Leaf Plots. WARNING: You MUST have SMART Technologies SMART
Subjects:
Grades:
4th - 7th, Staff

BUNDLE – Performance Tasks – Subtract Decimals & Absolute Value – Reality Check
BUNDLE – Performance Tasks – Subtract Decimals & Absolute Value – Reality Check
Now you can get more options and save money with this collection of all editions of Reality Check!
This set includes the Reality Check Performance Task in 5 different reality TV show editions. If you were to purchase each of these Performance Tasks individually, it would cost $20. At only $7, this bundle saves you about 65% off retail price!
In the Reality Check Performance Tasks, students use real audience da
Subjects:
Grades:
6th
Types:
Data Analysis & Probability - Drill Sheets Vol. 6 Gr. 6-8
**This is the chapter slice "Drill Sheets Vol. 6 Gr. 6-8" from the full lesson plan Data Analysis & Probability**About the FULL RESOURCE:For grades 6-8, our resource meets the data analysis & probability concepts addressed by the NCTM standards and encourages the students to review the concepts in unique ways. Each drill sheet contains warm-up and timed drill activities for the student to practice data analysis & probability concepts. The pages of this resource contain a variety in
Subjects:
Grades:
6th - 8th
Types:
DIGITAL Box Plots Worksheet Create and Analyze Box-and-Whisker-Plots Answer Key
Teachers ~ you'll LOVE this DIGITAL-for Distance Learning worksheet on Box-Plots, Box-and-Whisker-Plots. Students will create a Box-Plot and Analyze-the-Data to find the Mean, Median, Mode, Range, Lower Quartile, Upper Quartile, Interquartile Range, Least Value, and Greatest Value. Great practice, or use for Homework, a Math Station or Centers. Answer Key Provided. You get the DIGITAL-GOOGLE version for REMOTE learners PLUS the PDF version for FACE to FACE learners too! You'll enjoy using this y
Subjects:
Grades:
6th - 8th
Types:
Data Analysis & Probability - Task Sheets Gr. 6-8
Get familiar with mean, median, mode, and range, and how this can be used in daily life. Our resource provides task and word problems surrounding real-life scenarios. The task sheets provide a leveled approach to learning, starting with grade 6 and increasing in difficulty to grade 8. About this Resource:Examine fundraising amounts by finding the mean, median and mode. Create a pictograph and make observations from the data. Express answers from a circle graph in ratios and percents. Show patte
Subjects:
Grades:
6th - 8th
Types:
Also included in: Five Strands of Math - Tasks BIG BOOK - BUNDLE Gr. 6-8
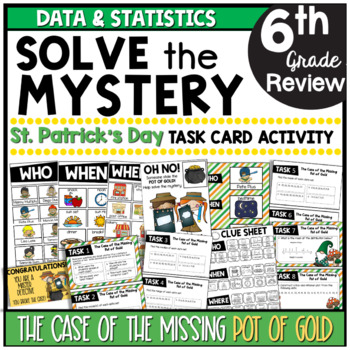
6th Grade Data and Statistics Solve The Mystery St. Patrick's Day Task Cards
I am excited to share this St. Patrick's Day MYSTERY CHALLENGE activity with you and your students! You will begin this activity by reading a short story that will challenge your students to solve the case of the missing pot of gold. They will have to find out who took the bags, when they took them, and where they put them. To solve the case, students will work to complete 9 different task cards. The task cards are based on the statistics and probability common core state standards. Once they co
Grades:
5th - 7th
Types:
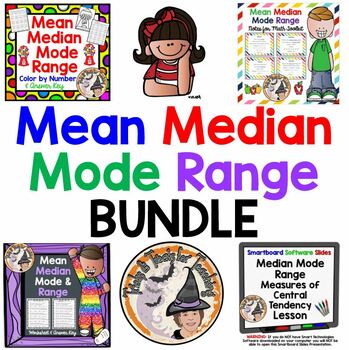
Mean Median Mode Range Color by Number Worksheets Notes Smartboard BUNDLE
Save some MONEY on this WONDERFUL-Bundle of resources to teach Mean-Median-Mode-Range. You get a Color-by-Number Answer Worksheet, along with Notes and an additional worksheet, and a Smartboard Slides Lesson all on Mean Median Mode and Range. Great variety for Differentiation and Spiraling Concepts too! You'll enjoy using these year after year!Be sure to L@@K at my other 1,285+ TERRIFIC teaching resources!~ ~ THANK YOU KINDLY ~ ~
Subjects:
Grades:
6th - 7th
Data Analysis & Probability - Drill Sheets Vol. 4 Gr. 6-8
**This is the chapter slice "Drill Sheets Vol. 4 Gr. 6-8" from the full lesson plan Data Analysis & Probability**About the FULL RESOURCE:For grades 6-8, our resource meets the data analysis & probability concepts addressed by the NCTM standards and encourages the students to review the concepts in unique ways. Each drill sheet contains warm-up and timed drill activities for the student to practice data analysis & probability concepts. The pages of this resource contain a variety in t
Subjects:
Grades:
6th - 8th
Types:
Data Analysis & Probability - Drill Sheets Vol. 5 Gr. 6-8
**This is the chapter slice "Drill Sheets Vol. 5 Gr. 6-8" from the full lesson plan Data Analysis & Probability**About the FULL RESOURCE:For grades 6-8, our resource meets the data analysis & probability concepts addressed by the NCTM standards and encourages the students to review the concepts in unique ways. Each drill sheet contains warm-up and timed drill activities for the student to practice data analysis & probability concepts. The pages of this resource contain a variety in t
Subjects:
Grades:
6th - 8th
Types:
Data Analysis & Probability - Drill Sheets Vol. 3 Gr. 6-8
**This is the chapter slice "Drill Sheets Vol. 3 Gr. 6-8" from the full lesson plan "Data Analysis & Probability"** About the FULL RESOURCE:For grades 6-8, our resource meets the data analysis & probability concepts addressed by the NCTM standards and encourages the students to review the concepts in unique ways. Each drill sheet contains warm-up and timed drill activities for the student to practice data analysis & probability concepts. The pages of this resource contain a variety i
Subjects:
Grades:
6th - 8th
Types:
Data Analysis & Probability - Drill Sheets Vol. 2 Gr. 6-8
**This is the chapter slice "Drill Sheets Vol. 2 Gr. 6-8" from the full lesson plan "Data Analysis & Probability"** About the FULL RESOURCE:For grades 6-8, our resource meets the data analysis & probability concepts addressed by the NCTM standards and encourages the students to review the concepts in unique ways. Each drill sheet contains warm-up and timed drill activities for the student to practice data analysis & probability concepts. The pages of this resource contain a variety i
Subjects:
Grades:
6th - 8th
Types:
Data Analysis & Probability - Drill Sheets Vol. 1 Gr. 6-8
**This is the chapter slice "Drill Sheets Vol. 1 Gr. 6-8" from the full lesson plan "Data Analysis & Probability"** About the FULL RESOURCE:For grades 6-8, our resource meets the data analysis & probability concepts addressed by the NCTM standards and encourages the students to review the concepts in unique ways. Each drill sheet contains warm-up and timed drill activities for the student to practice data analysis & probability concepts. The pages of this resource contain a variety i
Subjects:
Grades:
6th - 8th
Types:
Statistics Unit Review St. Patrick's Day Digital Activity
This St. Patrick's Day themed activity review the following concepts:Statistical QuestionsMeanMedianModeRangeBox PlotsFrequency TablesHistogramsInterquartile RangeChoose Appropriate MeasuresSummarize Data Distribution*This product is a Google Form
Subjects:
Grades:
6th
Types:
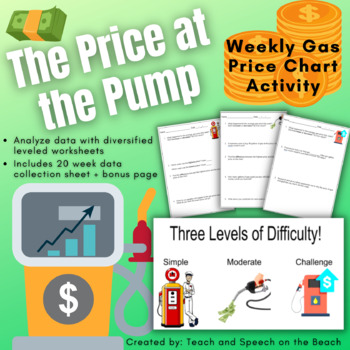
The Price at the Pump: Weekly Gas Price Chart and Data Analysis
Gas prices are all over the news! Make it make sense to your students with this activity. Check weekly average prices and chart the data. Watch as the price climbs (or hopefully falls!) and predict what will happen next. 3 levels of difficulty will give you the opportunity to differentiate instruction. This activity will get your students engaged with real life data and excited to chart the new price each week.
Subjects:
Grades:
3rd - 8th
Types:
CCSS:
St. Patricks Critical Thinking Math/ Probability Problem & Lesson
Need an ENGAGING real world math problem that incorporates critical thinking, statistics and probability, evidence based reasoning, and four leaf clovers?Great lesson for an introduction/review to a statistics unit that also covers multiple math practices!Includes: -complete teacher instructions-student mini worksheet-5 pictures as "evidence" for the problem-an article that is related to the problem to wrap up the lessonThank you!Miss Maddy MarsYou may also like:Pi Day Project (State Testing Rev
Grades:
5th - 8th
Types:
Showing 1-19 of 19 results


