TPT
Total:
$0.00

St. Patricks Critical Thinking Math/ Probability Problem & Lesson

371 Downloads
;
MissMaddyMars
69 Followers
Grade Levels
5th - 8th
Resource Type
Standards
Formats Included
  • PDF
Pages
7 pages
MissMaddyMars
69 Followers

Description

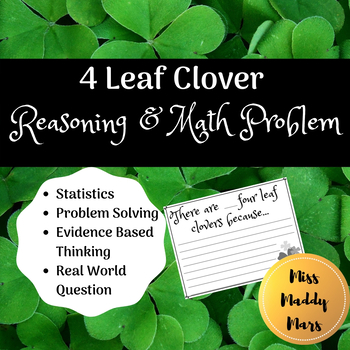
Need an ENGAGING real world math problem that incorporates critical thinking, statistics and probability, evidence based reasoning, and four leaf clovers?

Great lesson for an introduction/review to a statistics unit that also covers multiple math practices!

Includes:

-complete teacher instructions

-student mini worksheet

-5 pictures as "evidence" for the problem

-an article that is related to the problem to wrap up the lesson

Thank you!

Miss Maddy Mars

You may also like:

Pi Day Project (State Testing Review)

Exponent Lesson

Math Properties Posters

Terms of Use

Copyright © MissMaddyMars. All rights reserved by author. This product is to be used by the original downloader only. Copying for more than one teacher, classroom, department, school, or school system is prohibited. This product may not be distributed or displayed digitally for public view. Failure to comply is a copyright infringement and a violation of the Digital Millennium Copyright Act (DMCA). Intended for classroom and personal use ONLY.

Total Pages
7 pages
Answer Key
N/A
Teaching Duration
50 minutes
Report this resource to TPT
Reported resources will be reviewed by our team. Report this resource to let us know if this resource violates TPT’s content guidelines.

Standards

to see state-specific standards (only available in the US).
Recognize a statistical question as one that anticipates variability in the data related to the question and accounts for it in the answers. For example, “How old am I?” is not a statistical question, but “How old are the students in my school?” is a statistical question because one anticipates variability in students’ ages.
Summarize numerical data sets in relation to their context, such as by:
Understand that statistics can be used to gain information about a population by examining a sample of the population; generalizations about a population from a sample are valid only if the sample is representative of that population. Understand that random sampling tends to produce representative samples and support valid inferences.
Use data from a random sample to draw inferences about a population with an unknown characteristic of interest. Generate multiple samples (or simulated samples) of the same size to gauge the variation in estimates or predictions. For example, estimate the mean word length in a book by randomly sampling words from the book; predict the winner of a school election based on randomly sampled survey data. Gauge how far off the estimate or prediction might be.
Use ratio and rate reasoning to solve real-world and mathematical problems, e.g., by reasoning about tables of equivalent ratios, tape diagrams, double number line diagrams, or equations.

Reviews

Questions & Answers

69 Followers