9 results
Mental math Common Core 5.MD.B.2 resources for Google Apps
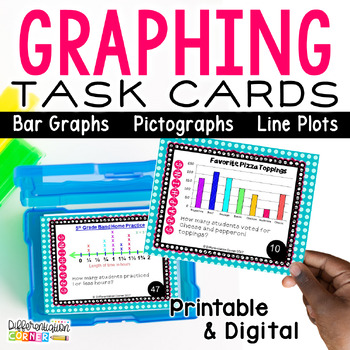
Graphing Task Cards: Line Plots, Bar Graphs and Pictographs Graphing Activities
Practicing data and graphing? This set of Graph Task Cards will help students read and interpret line plots, bar graphs, and pictographs. Use these cards as a graphing game in whole group or use as graphing practice in a math center!There are 60 unique printable & digital cards practicing Common Core Standards covering measurement and data for three types of graphs.I have them laminated in a basket for students to use during math center time. They work with partners, record their answer for
Subjects:
Grades:
3rd - 5th
Types:
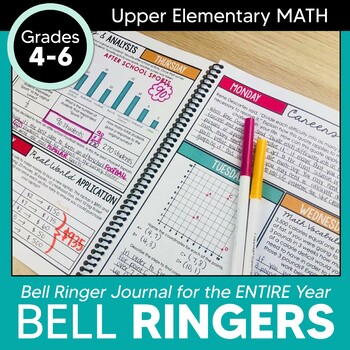
Math Bell Ringer Journal: 4th & 5th Grade Morning Work Back to School Activities
Use this mathematics Bell Ringer Journal for the entire school year to strengthen your students' problem solving and critical thinking skills. This journal includes 275 math themed journal prompts for 4th and 5th grade students. Looking for back to school activities? This bell ringer journal is a great way to create and establish routine while also strengthening skills!This product provides teachers with an entire school year of mathematics-themed journal prompts in an organized and focused way
Subjects:
Grades:
4th - 6th
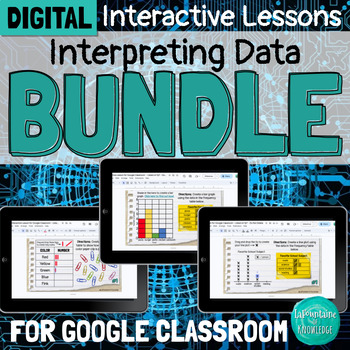
DIGITAL Interpreting Data Interactive Lesson Bundle for Google Classroom
This bundle of 3 digital interactive math lessons for Google Classroom teaches interpreting categorical and numerical data using frequency tables, bar graphs, and line plots. Each lesson includes: a video lesson (YouTube and Loom viewing options included) practice problems and activitiesteacher directions and answer keysThese lessons are ready to assign and easy for students to complete independently. Students will learn:important vocabulary - title, categories, tally marks, key, categorical dat
Subjects:
Grades:
3rd - 5th
Types:

Line Plots Interpreting Categorical and Numerical Data Google Slides Lesson
This Google Slides math lesson introduces students to line plots that are used to organize, graph, and interpret both categorical and numerical data. It also includes scaled line plots. This lesson:reviews frequency tables as a way of keeping track of dataexplains the parts of a line plot including title, categories, and keydemonstrates how to create a line plot using the data from a frequency table by adding x's to represent the dataexplains the difference between categorical and numerical data
Subjects:
Grades:
3rd - 5th
Types:
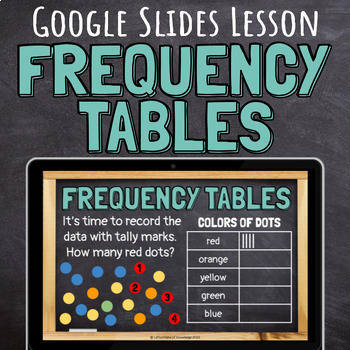
Frequency Tables Interpreting Categorical and Numerical Data Google Slides
This Google Slides math lesson introduces students to frequency tables that are used to organize and interpret both categorical and numerical data. This lesson:explains the parts of a frequency table (title, categories, tally marks)demonstrates how to count tally marks explains the difference between categorical and numerical dataprovides questions to practice interpreting both types of data (just click to reveal the answers) models how to create a frequency table to organize and display dataThe
Subjects:
Grades:
3rd - 5th
Types:
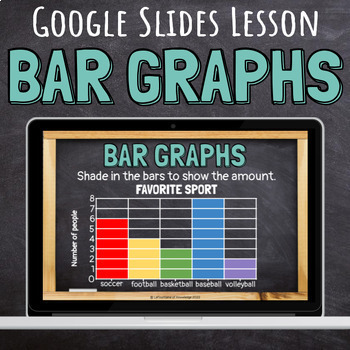
Bar Graphs Interpreting Categorical and Numerical Data Google Slides Lesson
This Google Slides math lesson introduces students to bar graphs that are used to organize and interpret both categorical and numerical data. It also includes scaled bar graphs. This lesson:reviews frequency tables as a way of keeping track of dataexplains the parts of a bar graph including title and categoriesdemonstrates how to create a bar graph using the data from a frequency table by shading in the bars explains the difference between categorical and numerical dataprovides questions to prac
Subjects:
Grades:
3rd - 5th
Types:
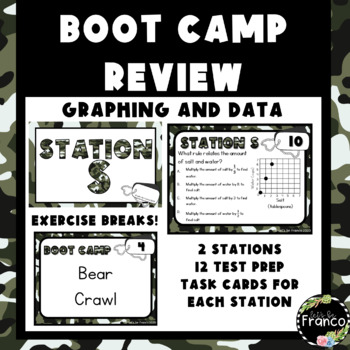
Graphing and Analyzing Data Review Task Cards and Google Form - Test Prep
Want an engaging test prep activity? Look no further! Students will complete task cards to review for standardized tests. This is a great review for PARCC, NJSLA or any other common core standardized test. These stations include analyzing graphs, line graphs, and data. The questions are varied with a selection of open-ended questions, multiple choice, and multi-select questions. Use this to also get your students up and moving about the classroom with the boot camp exercises! Try it out and then
Subjects:
Grades:
4th - 6th
Types:
Also included in: 5th Grade Math Test Prep Bundle Task Cards Boot Camp and Google Forms
EnVision Number Talk Google Slides for 5th Grade Topic 10 (Interpret Data)
Use these Number Talk Slides to begin each EnVision lesson. These slides build mathematical literacy and create rich classroom discussion before digging deeper into the each lesson objective. Using these slides before each lesson better equips students to reach the lesson target. Students will engage in meaningful discussions about numbers and how they relate to the topic and lesson. These Google lesson Slides are designed to be used with an Interactive Whiteboard but can also work with a tv.T
Subjects:
Grades:
5th
CCSS:
Also included in: EnVision Topic 10 (Interpret Data) Resource Bundle - 5th Grade
Math Exit Ticket 4th Quarter
ONLINE RESOURCE! This is math edible exit tickets for 4th Quarter in a Google Slide document.
Subjects:
Grades:
4th - 5th
Types:
Also included in: Whole Year of Math Exit Tickets
Showing 1-9 of 9 results


