16 results
Graphing Common Core RI.4.7 resources
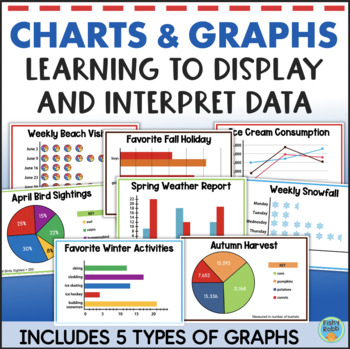
Math Graphing Activities Interpreting Graphs and Data Worksheets Line Pie Bar
Representing and interpreting data using graphs and charts is the focus of this math resource for upper elementary grades. It helps students explore and understand data analysis. For each activity, students will use a graph to answer questions about the data. They will also create another type of graph, chart, or table based on the information provided. This added step really helps students understand the various types of graphs and ways in which data can be displayed.These activities are perfec
Subjects:
Grades:
3rd - 5th
Types:
Also included in: Third Grade Math & Reading YEAR LONG BUNDLE 1500+ Pages
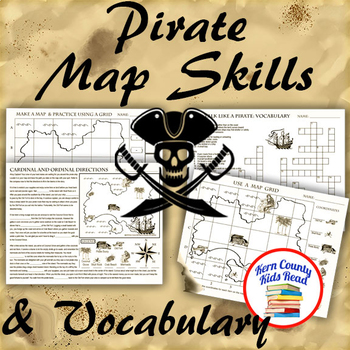
Pirate Map Skills: Grid Coordinates, Cardinal & Ordinal Directions, Symbols
Teach and strengthen coordinate grid math, geography mapping skills like map symbols and cardinal and ordinal directions with a compass rose, and new vocabulary with these pirate themed printable worksheets. These are fun mini-lesson activities for Talk Like A Pirate Day on September 19th or if you have a pirates themed unit. Cardinal directions and coordinate grid mapping are important introductory skills to mastering latitude and longitude map skills and being able to use an atlas. Coordinate
Subjects:
Grades:
3rd - 6th
Also included in: Pirates Thematic Unit Study Bundle: Talk Like A Pirate Pack!
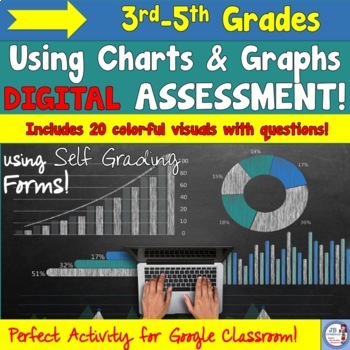
Reading Charts, Graphs, & Tables Google Form Assessment
Assess students quickly and efficiently on reading and interpreting information using CHARTS, GRAPHS, and TABLES with this self grading GOOGLE FORM! 20 multiple choice questions with colorful graphics are included that test student knowledge on reading bar graphs, pie graphs, tally sheets, line/plot graphs, and tables. You will be given the ability to make and customize your own copy of this form when accessing this directly from my own Google Drive! The self grading quiz mode makes assessment
Subjects:
Grades:
3rd - 6th
Types:
Also included in: Language Arts Standards Digital Assessment Bundle (Self Grading)
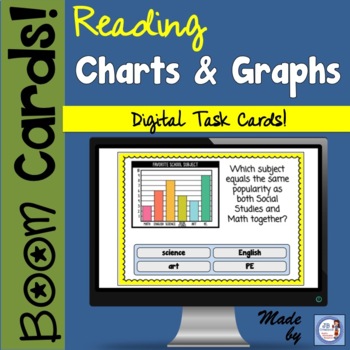
Interpreting Charts & Graphs BOOM Cards!
Use BOOM cards for a super engaging, fun way to read and interpret charts, graphs, and tables! Students will scroll through and receive immediate feedback when interacting with 24 colorful task cards with exciting graphics to identify the type of graph and interpret the provided information.What exactly are BOOM Cards??They are digital task cards that provide immediate feedback as students interact with them! They can be easily be uploaded and used on chromebooks, iPads, Smartboards, Tablets, Ki
Subjects:
Grades:
3rd - 6th
Types:
CCSS:
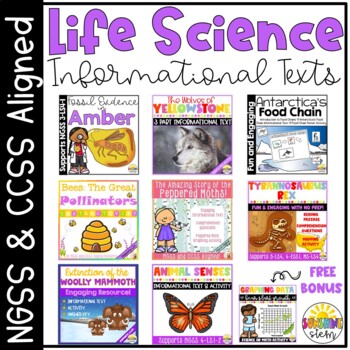
Huge Life Science Informational Text Bundle! Great for Distance Learning!
Great for distance learning use!This HUGE bundle contains EIGHT high-interest informational texts to support NGSS life and earth science units! Each resource begins with an engaging informational text before students APPLY what they learn with comprehension questions and an activity. Activities vary for each resource including; graphing data, analyzing maps, designing solutions, creating a poster, writing a presentation, matching concepts and sketching ideas. Great to use as classwork, homewo
Subjects:
Grades:
3rd - 6th
Types:
NGSS:
3-LS4-1
, MS-LS2-2
, MS-LS2-1
, 4-LS1-2
, 3-LS4-2
...
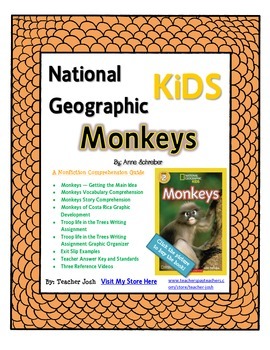
National Geographic Kids Monkeys {Nonfiction Comprehension Guide}
The nonfiction lesson activities provided throughout this comprehension guide along with the text, will provide students with a range of meaningful and deliberate practices to improve learning. Each of these lessons can be given as classroom work, homework, or can work great as center activities. The nonfiction text will engage the student and the lessons are created so scaffolding can be addressed as needed.
Download the sample preview to see every page!
Every student enjoys reading these Nat
Weather Data Charts and Graphs
There’s no better way to learn about charts and graphs than to create authentic ones! This charts and graphs set focuses on collecting weather data, something that all students understand and all teachers have access to a variety of data on the topic. These are great to use during a weather unit in science, for beginning of the day calendar math programs or for a math unit teaching charts and graphs. Blank templates are included and can be used for any type of chart/graph that you may need fo
Subjects:
Grades:
1st - 5th
Types:
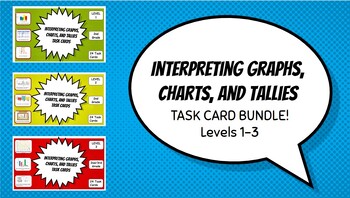
Interpreting Charts, Graphs, and Tallies Task Cards LEVELS 1-3!
Introduce, reinforce, and extend student understanding of the interpretation of charts, graphs, and tallies with these leveled task cards! This set costs $9 if purchased separately. Save 20% by purchasing this 3-set bundle!LEVEL 1 - These 24 task cards are perfect for introducing graphs, charts, and tally analysis to 1st and 2nd-grade students!LEVEL 2 - These 24 task cards are perfect for reinforcing the skill of chart, graph, and tally interpretation, and are best suited for 2nd and 3rd-grade s
Subjects:
Grades:
1st - 4th
Types:

Geography Task Cards for Elementary Montessori
Guide cards, task cards, work cards: These cards break down the Keys of the Universe album contents into independent working moments for the children. They are compatible with any AMI resources. These cards are intended for children who have received the initial presentation from the adult. Each card leaves plenty of space on the front and back for the adult or the child to add additional notes as needed, including resources, diagrams, etc. Fully adaptable to each student's needs! Printing instr
Subjects:
Grades:
1st - 8th
Interpreting Charts, Graphs, and Tallies Task Cards LEVEL 3
DescriptionThese task cards are perfect for 3rd-grade students, advanced/gifted 2nd-graders, or fourth-grade review. Reinforce and further develop students' critical thinking and interpretation skills!Product Includes: 1. 24 Task Cards 2. Answer Key This product was created in alignment with the following Missouri Learning Standards and item specifications. 1.DS.A.2 Draw conclusions from object graphs, picture graphs, T-charts, and tallies. How to implement: Use this for small groups, partner
Subjects:
Grades:
2nd - 4th
Types:
Also included in: Interpreting Charts, Graphs, and Tallies Task Cards LEVELS 1-3!

Math Song: The Graphing Song
Do you want your students to be engaged, have fun, and remember key concepts of your lesson? ADD MUSIC! Music can change any lesson into something memorable. By Wild Child Designs, this song introduces key graphing vocabulary with lyrics written to the tune of "At The Hop." It's peppiness, along with the hilarity that can ensue when a teacher makes it "her own" by adding choreography and costume, will cement graphing vocabulary in your students' minds. This product includes black and white,
Subjects:
Grades:
3rd - 5th
Types:
Nonfiction Reading and Graph Skills Practice
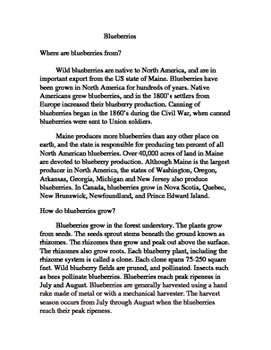
This packet includes a nonfiction reading on blueberries with open response questions, as well as two graphs that require students to read and interpret the graph and answer the questions that follow. Great math and ELA test prep.
Subjects:
Grades:
3rd - 5th
Types:
Interpreting Information Graph ~ Halloween Candy ~ CCSS RI.4.7 & 3.MD.B.3
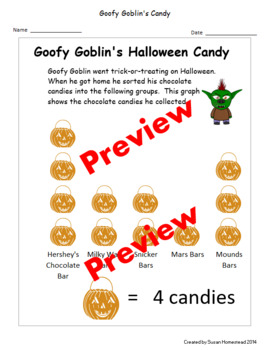
This activity requires students to answer questions based on the information in the picture graph. Many of the questions require math computation. Here are a few of the questions: * How many more Hershey Bars than Milky Way Bars did Goofy Goblin collect?* Which did Goofy Goblin Collect more of Snickers Bars or Mounds Bars? How many more?* Goofy Goblin gave away half of his Mounds Bars and half of his Snickers Bars, How many bars did he give away?* How many chocolate candies did Goofy Gobli
Subjects:
Grades:
3rd - 4th
Types:
Data Analysis and Probability Smartboard Lesson.
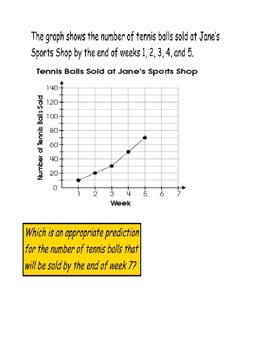
The smartboard lesson reaches more learning syles with in the classroom. This smartboard lesson has 46 slides. This is comprehensive. Your students will learn how to read charts and graphs as well as how to problem solve. We hope it helps your students.
You can download a copy of the Data Analysis and Probability Journal too at our store, so your students can follow along more engaged using paper pencil. created by teams4education
credits to ode-ohioportal.
Subjects:
Grades:
3rd - 4th
Types:
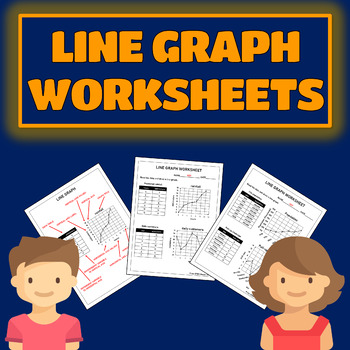
Line Graph Worksheets
math and statistics worksheets covering line graph plotting practicetwo worksheets with two sets of data eachtwo versions: - grid only- axis labels and valuesone worksheet where students name parts of line graph presentationtwo versions:- empty boxes for answers- connect words to right placesCommon core assessments:✅✅✅Grade 3 Math CCSS Assessment Bundle Print & Digital✅✅✅✅✅✅Grade 4 Math CCSS Assessment Bundle Print & Digital✅✅✅✅✅✅Grade 5 Math CCSS Assessment Bundle Print & Digital✅✅✅
Grades:
4th - 7th
Types:
CCSS:
Also included in: Graphing Worksheet Bundle
United States Census - Understanding Population Change
Do you want a quick and easy way to discuss the importance of the US Census with your third or fourth graders? If so, consider this resource. By the end of the lesson, students will be able to:•Understand why the United States Census is important•Draw conclusions from data to answer questions•Graph data on a chart
Subjects:
Grades:
3rd - 4th
Showing 1-16 of 16 results


