138 results
Statistics worksheet microsofts $5-10
Mean, Median, Mode, and Range (Bundled Unit) - Distance Learning
This is an enjoyable, interactive, and engaging bundled unit covering mean, median, mode, and range (and introduces outliers). This unit is great for 5th and 6th graders and 7th graders who struggle with these concepts.Included in this bundled unit:PowerPointAnimated and fun 4-part, 21-slide PowerPoint (multi-day use)-Part 1 – The Meaning of Mean-Part 2 – Getting in the Middle of Median-Part 3 – Making the Most of Mode-Part 4 – Home, Home on the RangeEach section offers plenty of practice probl
Subjects:
Grades:
5th - 7th
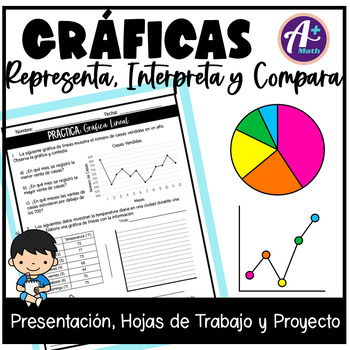
Gráficas - Estadística
Gráficas - Estadística - Analizar DatosEste recurso trabaja los siguientes temas:Gráficas: Representa, Interpreta y Compara•Recopilar y Organizar Datos •Tabla de Frecuencias•Gráfica de Barras•Gráfica Circular•Gráfica Pictórica•Gráfica Lineal•Tabla de Tallo y Hojas•Diagrama de PuntosEl recurso incluye:•Presentación en PowerPoint y PDF - 55 diapositivas con explicaciones y ejemplos•8 hojas de trabajo - Incluye la clave de respuestas•3 hojas de trabajo - Proyecto - Encuesta y analiza los res
Subjects:
Grades:
4th - 6th
Probabilidad - Eventos Simples y Compuestos - Diagrama de Árbol
Probabilidad - Eventos Simples y Compuestos - Diagrama de ÁrbolEste recurso trabaja los siguientes temas:Eventos simplesProbabilidadResultados favorables Resultados posibles Espacio muestralEventos posibles, seguros o imposibles Hallar la probabilidad de eventos simplesEventos compuestos independientesRegla de multiplicaciónDiagrama de árbol y probabilidadEl recurso incluye:•Presentación en PowerPoint y PDF - 64 diapositivas con explicaciones y ejemplos•5 hojas de trabajo - Incluye la clave de r
Subjects:
Grades:
5th - 7th
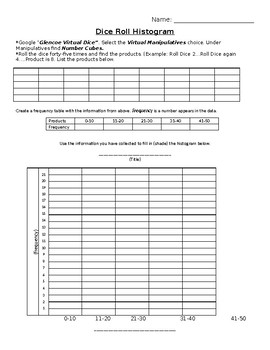
Dice Roll Histogram - Online Interactive Activity Frequency Table & Historgram
Students will complete a frequency table and histogram that corresponds to data collected through the use of rolling two dice (Statistics Lesson). To get the data for this frequency table, students will roll two dice and multiple the numbers rolled together. The product of these two rolls will be the data point. Students will write down each product, rolling their dice a total of 45 times. Students will then fill in the frequency table and graph on a histogram. We used an online dice. This helps
Subjects:
Grades:
5th - 8th
Types:
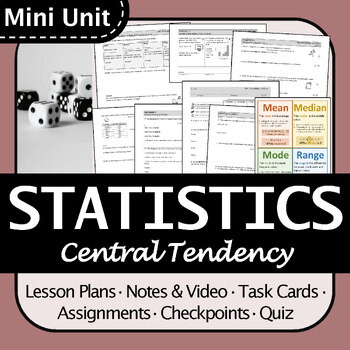
BC Math 8 Measures of Central Tendency Mini Unit, Engaging, Differentiated
This is an engaging mini unit that would work great for an in-depth look at measures of central tendency (mean, median, mode, and range) and how to choose them. The resources are well-organized and differentiated so they are accessible to a wide range of students.Students learn:How to calculate mean, median, mode, and range from a data set or frequency table.How to choose the best measure of central tendency (mean, median, or mode) given a particular situation or data set. Includes:Detailed les
Subjects:
Grades:
6th - 9th
Types:
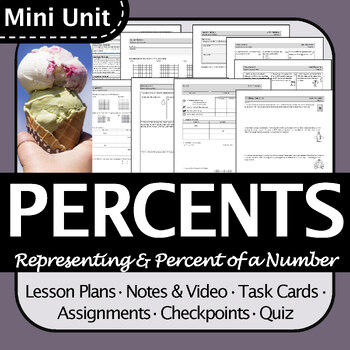
Mini Unit: Percents & Percent of a Number | Fun, Engaging, Differentiated!
This is an engaging mini unit that would work great for an in-depth look at representing percents and percent of a number. The resources are well-organized and differentiated so they are accessible to a wide range of students.Students learn:Representing percents (visually, decimals, fractions)Percent of a number in multiple ways (mental math, multiplying)Includes:Detailed lesson plans 2 number talks2 sets of comprehensive and visual scaffolded notes (with lesson video).2 Sets of task cards for
Subjects:
Grades:
6th - 9th
Types:
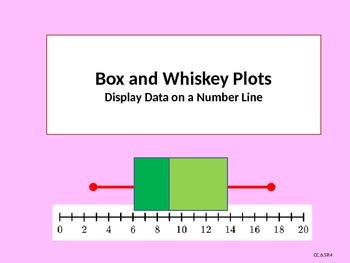
Box and Whisker Plots with Student Worksheet
Box and Whisker Plots with Student Worksheet is an introductory PowerPoint presentation teaching students what a Box and Whisker Plot is and how it can be used with data.
Students will learn how to make a Box Plot. Find the Median, (Q2) the Lower or First Quartile (Q1) and Upper or Third Quartile (Q3).
Bright colors and animation hold attention. Great for whole class or small group intervention. Differentiated instruction and visual representation for the Special Education students or visua
Subjects:
Grades:
5th - 7th
CCSS:
Statistics Unit 3 Bundle - Central Tendency and Variation Curriculum (9 days)
Statistics Unit 3 Bundle - Central Tendency and Variation Curriculum (9 days)This is a unit plan bundle for a Statistics class. The plans include common core math standards, time frame, activities, enduring understandings, essential questions, and resources used. It is designed to last 2 weeks. The bundle includes:28-slide presentation, with annotated guide for reference2 Worksheets"Do Now" Entrance problems1 Quiz2 Spreadsheet activities (Mean Median Mode Spreadsheet Project from my store includ
Subjects:
Grades:
9th - 12th, Higher Education
CCSS:

IB Sports Exercise and Health Science: Unpaired T-Test Swimming
This is a resource that can be used when learning about T-Testing. It is an unpaired T-Test that is designed to go against what other research has suggested. It introduces the students to the idea of "poorly" designed studies and allows them to explain what changes would need to be made moving forward.There is a TOK extension about identification of biological sex.
Subjects:
Grades:
11th - 12th
Types:
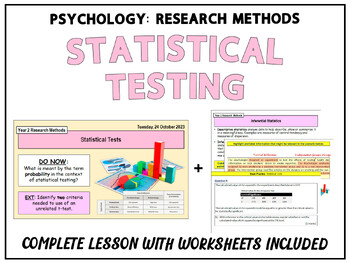
RESEARCH METHODS IN PSYCHOLOGY: Statistical Testing
To request lessons, provide feedback or if you have had any issues opening any resources of my resources, please feel free to contact me on jb_resources@outlook.com (responses are usually very prompt).Key content covered in this Lesson:Key QuestionsDescriptive vs. Inferential StatisticsInferential Statistics in PsychologyStatistical Tests: Wilcoxon, Related t-test, Chi-squared, Mann Whitney, Unrelated t-test, Spearman's Rho, Pearons rLearning the Decision TreeWhen to Use Parametric TestsStatisti
Subjects:
Grades:
Not Grade Specific
Also included in: RESEARCH METHODS IN PSYCHOLOGY [UNIT 2 COMPLETE MODULE]
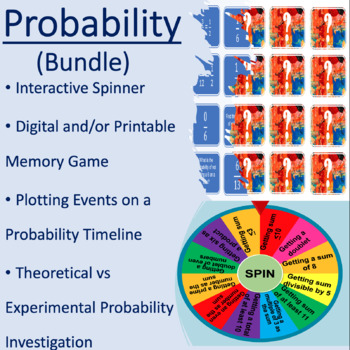
Probability:Interactive Games,Events on Number line,Theoretical and Experimental
By purchasing this bundle, you will save 10% off the individual resources! Plotting events on a probability timeline and relating fractions to likelihood:This product includes:+ Plotting events on a probability timeline (Three versions include: Interactive PowerPointä, Cut and paste, and Draw a Line)+ Fun and interactive matching memory game for probability (chances of events happening)+ Printable matching memory game for probability + Post-test (probability reflection questions) Investigate the
Subjects:
Grades:
5th - 6th

AP Statistics Design Unit: Experimental Design Worksheet #1
FRQ style worksheet over the types of experimental design.
Subjects:
Grades:
9th - 12th
Types:
Also included in: AP Statistics Design Unit
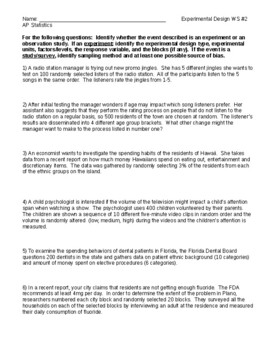
AP Statistics Design Unit Experimental Design Worksheet #2
FRQ style worksheet over experimental design types, blocking, variable of interest, experimental units, etc.....
Subjects:
Grades:
9th - 12th
Types:
Also included in: AP Statistics Design Unit

Statistical Math (GED REVIEW)
Statistical Math
Data analysis statistics and probability worksheets ,63 problems
GED Review
Fraction and Data (29 Multiple choice questions)
Statistic Problem (15 questions)
Probability Word Problems
This section contains 19 word problems about :
Simple Probability
Counting Principle
Independent Probability
Dependent Probability
Mutually Exclusive Events
Permutations
Combinations
Conditional Probability
* AlSO AVAILABLE FOR YOU OR A COLLEAGUE! - CLICK ANY LINK YOU WANT:
Geometry (GED R
Subjects:
Grades:
9th - 12th, Higher Education, Adult Education, Staff
Types:
Standard Deviation and Interquartile Range Bundle (distance learning)
Finding standard deviation and interquartile range can be challenging for students. The presentations and the notes in this bundle break down the processes with step by step instructions. The bundle combines two powerpoints to explain how to find both standard deviation and IQR and two documents with students notes on finding both with and without a graphing calculator as well as student problems on both processes.
Subjects:
Grades:
7th - 10th
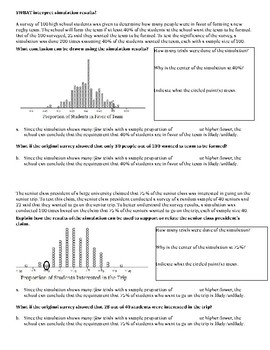
Interpreting Simulation Results (Counting Dots)- Algebra II Common Core
"What's with the dots?"
This lesson teaches students how to interpret simulation results, aka "the dots". This following is covered here:
1. Where do the dots come from? What do they mean?
2. What is a simulation? How is it conducted?
3. How can we tell if results are significant?
4. How can we construct a confidence interval using simulation results?
5. How can we determine the plausibility of population proportions using a confidence interval?
This lesson was used for a New York State Algeb
Subjects:
Grades:
10th - 12th
Types:
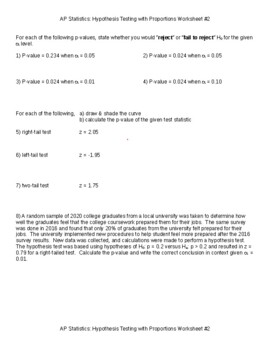
Hypothesis Testing with Proportions Worksheet #2
8 questions covering the calculation of p-values, their comparison to the significance levels, and writing conclusions. All questions are original and cannot be googled.
Subjects:
Grades:
9th - 12th
Types:
Also included in: Hypothesis Testing with a Single Proportion
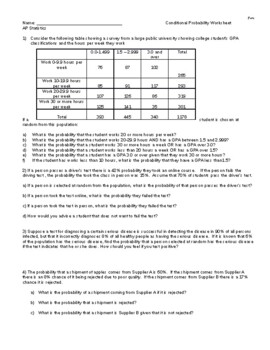
AP Statistics: Conditional Probability Worksheet
Free Response Style Free Response Questions over Conditional Probability
Subjects:
Grades:
9th - 12th
Types:
Also included in: AP Statistics: Probability Unit
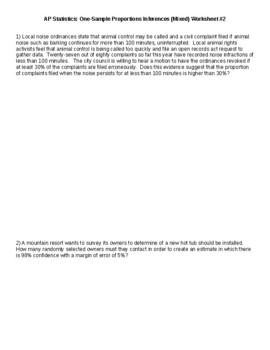
One Sample Inferences with Proportions Worksheet #2
4 free response questions over Confidence Intervals and Hypothesis Testing with Proportions using a single sample. All questions are original and cannot be googled. Full key included.
Subjects:
Grades:
9th - 12th
Types:
Also included in: Hypothesis Testing with a Single Proportion
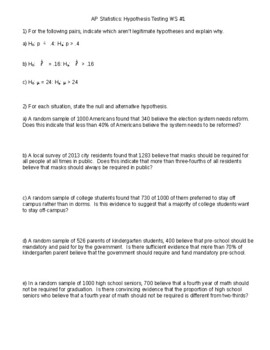
Hypothesis Testing with Proportions Worksheet #1
Free response style questions that help students practice writing hypotheses. Original questions, answers cannot be googled.
Subjects:
Grades:
9th - 11th
Types:
Also included in: Hypothesis Testing with a Single Proportion
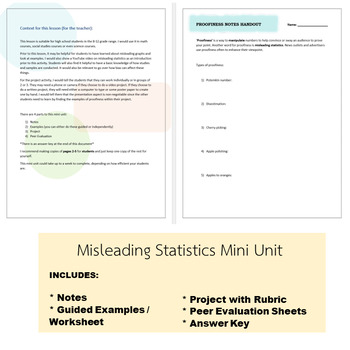
Misleading Statistics Lesson + Project
Mini unit on misleading statistics (AKA proofiness)! There are 4 parts to this unit:1) Notes2) Examples3) Project4) Peer EvaluationAnswer key is included which makes this a great unit for a substitute if you need something to fill up a few classes! Students will learn about proofiness (just another word for misleading statistics) concepts such as cherry picking, disestimation and other ways that numbers can be distorted in the media. Can be used in math, social studies or even science classes!Th
Subjects:
Grades:
9th - 12th
Types:
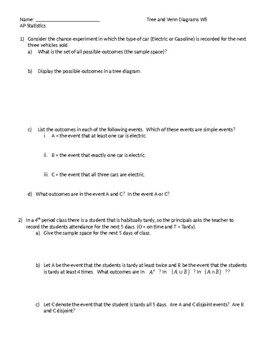
AP Statistics: Venn Diagram Worksheet
Worksheet over using Venn Diagrams for Probability Simulations
Subjects:
Grades:
9th - 12th
Types:
Also included in: AP Statistics: Probability Unit

AP Statistics: Probability Worksheet #1
1st of 3 worksheets over the 7 rules of probability. This worksheet included Venn Diagrams, Sample Space, Unions and Intersections
Subjects:
Grades:
9th - 12th
Types:
Also included in: AP Statistics: Probability Unit
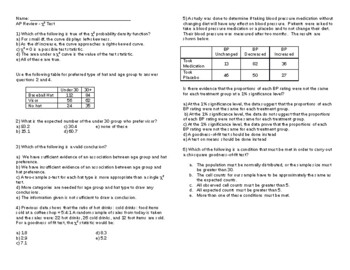
Chi-Square AP Review- for AP Stats
10 question multiple choice review over Chi-Square testing for AP Stats, key included
Subjects:
Grades:
9th - 12th
Types:
Also included in: Chi-Square Unit: AP Stats
Showing 1-24 of 138 results


