10 results
10th grade specialty Common Core 3.MD.B.3 resources
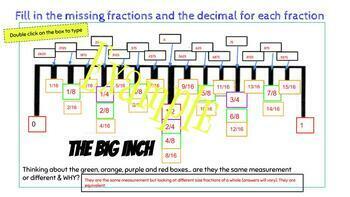
Measurement Galore - Reading a Tape Measure
This product come from struggling to teach students how to use the measuring tape and how to understand the fractions on a measuring tape. It has multiple representations of reading fractions on a measuring tape and fraction bar. It has spaces to type in answers and printable test pages to assess learning. It shows multiple ways to represent the same fraction (equivalent fractions). It is fun, yet rigorous. I included websites where your students can go to play online measurement games and vi
Grades:
3rd - 12th, Higher Education, Adult Education
Types:
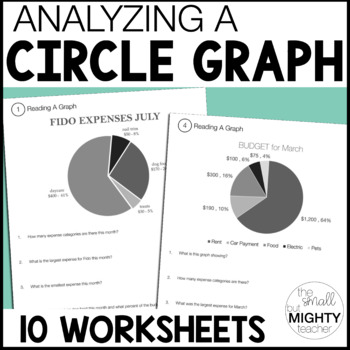
Analyzing Graphs Worksheets - Circle Graphs
Are your students working on analyzing circle graphs? This will give them plenty of practice - this includes 10 worksheets, asking students to analyze and interpret graphs. Print and go with this easy to implement and engaging resource! Great for:homework / classwork practice / rotations, station worktracking IEP or other goals on a regular basisThis includes:10 worksheets (5 questions each) each with a unique graph answer keyCollect Data on this skill with my FREE data sheet collection.Download
Subjects:
Grades:
3rd - 10th
Types:
CCSS:
Also included in: Reading A Graph BUNDLE
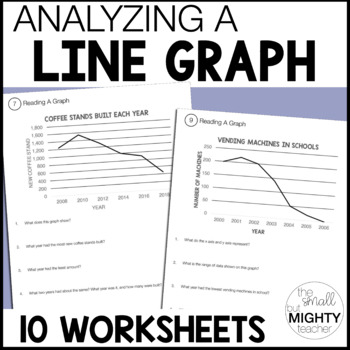
#summerwts Analyzing Graphs Worksheets - Line Graphs
Are your students working on analyzing graphs? This will give them plenty of practice - this includes 10 worksheets, asking students to analyze and interpret line graphs. Print and go with this easy to implement and engaging resource! Great for:homework / classwork practice / rotations, station worktracking IEP or other goals on a regular basisThis includes:10 worksheets (5 questions each) each with a unique graph answer keyCollect Data on this skill with my FREE data sheet collection.Download t
Subjects:
Grades:
3rd - 10th
Types:
CCSS:
Also included in: Reading A Graph BUNDLE
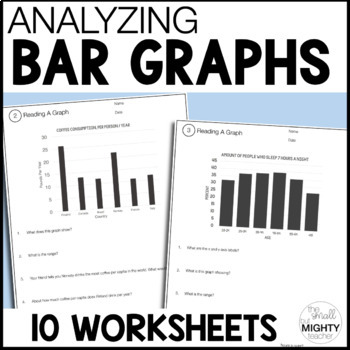
Analyzing Bar Graphs Worksheets
Are your students working on analyzing bar graphs? This will give them plenty of practice - this includes 10 worksheets, asking students to analyze and interpret bar graphs. Great for:homework / classwork practice / rotations, station worktracking IEP or other goals on a regular basisThis includes:10 worksheets (5 questions each) each with a unique graph answer keyCollect Data on this skill with my FREE data sheet collection.Download the data sheets HERE!_____✉ Questions? ✉Please check out the f
Subjects:
Grades:
3rd - 10th
Types:
CCSS:
Also included in: Reading A Graph BUNDLE
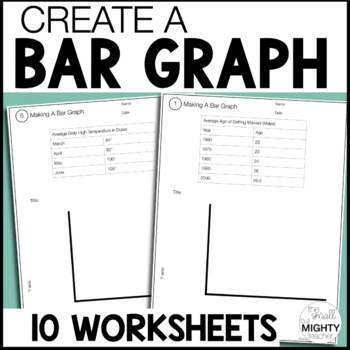
Create A Bar Graphs Worksheets
Are your students working on creating bar graphs? This will give them plenty of practice - this includes 10 worksheets, with unique data sets. This is a great way for students to extend their knowledge of bar graphs and provides fading supports with labeling the x and y axis as well as the title.Great for:homework / classwork practice / rotations, station worktracking IEP or other goals on a regular basisThis includes:10 worksheets (5 questions each)answer key_____________✉ Questions? ✉Please ch
Subjects:
Grades:
3rd - 10th
Types:
CCSS:
Also included in: Reading A Graph BUNDLE
FREE EDUCATIONAL WEBSITES LIST 4 ALL GRADES K-12 AND SUBJECTS + TEACHER RESOURCE
Sometimes, you just need a list of websites for everyone. Here it is. FREE EDUCATIONAL WEBSITES Put together by Teach Me, Maria!It takes time to gather this information, figure out the appropriate grade levels, and format, maintain, and update this page. All I ask is for an honest review if this list helps you.
Subjects:
Grades:
PreK - 12th, Staff
Types:
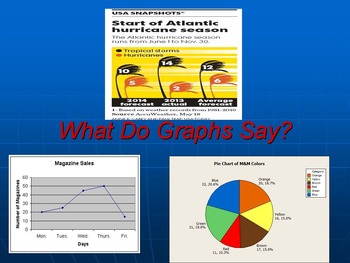
What Do Graphs Say?
This set of 20 activities will answer the question “What do graphs say?”. Challenge your students to analyze graphics and respond to given questions will improve their problem solving skills.
Teachers may use this packet as a cooperative group lesson, assigned homework, board work, after student completion of assignment activity, and many others.
Common core standards that will be met in this activity include CCSS. math content .3MD.B.3 and 3MD.B.4.
Presented in PDF or Power Point
Subjects:
Grades:
3rd - 12th, Adult Education
Types:
Google Sheets Bar Charts (Distance Learning)
Create bar charts using Google Sheets. Learn how to format the bar charts to represent information and trends. Create stacked and horizontal bar charts. Get a copy of the data in the lessons so you can follow along. Learn to publish charts using Docs, Slides, Sheets, or Sites.
Subjects:
Grades:
2nd - 12th, Higher Education, Adult Education, Staff
Types:
CCSS:
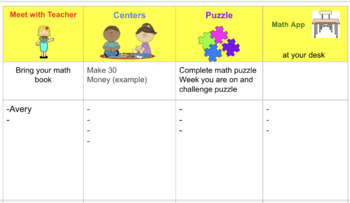
Editable Math Rotations Google Slides Powerpoint! Timers included
This is an editable, easy-to-follow math rotation Google Slides presentation. Easily create duplicates of slides to quickly rotate groups. Multiple options of timers are included to copy and paste into any part of your math rotation slides.
Grades:
PreK - 12th
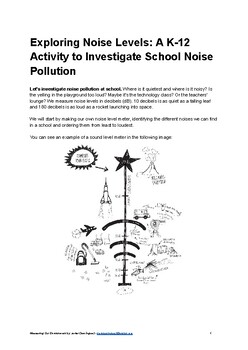
Exploring Noise Levels: A K-12 Activity to Investigate School Noise Pollution
In this engaging and educational activity, students will embark on a journey to explore and understand noise pollution within their school environment. The central question of this activity is, "How noisy is a school day?" Through this exploration, students will learn about noise levels, measured in decibels (dB), and gain awareness about the varying degrees of sound in different school settings.Objective:The main objective is to help students comprehend the concept of noise pollution and its p
Subjects:
Grades:
3rd - 12th
Showing 1-10 of 10 results

