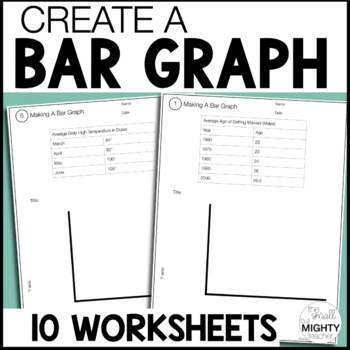
Create A Bar Graphs Worksheets
- Zip
Also included in
- Bundle & Save with this bar, line and circle graph bundle. Students will analyze and answer questions about a variety of graph types giving them plenty of opportunities to practice. Then, with unique data sets, students are prompted to create their own graphs!You'll love this because:provide a vPrice $9.00Original Price $12.00Save $3.00
Description
Are your students working on creating bar graphs? This will give them plenty of practice - this includes 10 worksheets, with unique data sets. This is a great way for students to extend their knowledge of bar graphs and provides fading supports with labeling the x and y axis as well as the title.
Great for:
- homework / classwork practice / rotations, station work
- tracking IEP or other goals on a regular basis
This includes:
- 10 worksheets (5 questions each)
- answer key
_____________
✉ Questions? ✉
Please check out the full listing before purchasing to ensure that this meets your needs!
If you have any questions feel free to ask in the FAQ or email me: Anna@thesmallbutmightyteacher.com
☆ Follow Me ☆
CLICK HERE to follow my store -- you will be the first to know about new resources, sales, discounts & more!
☑ Earn TpT credits! ☑
Leave feedback and earn TpT credits for future purchases. Look under "My Purchases" and click on "Leave A Review" - your feedback helps future buyers and me to create better resources for you ☺


