247 results
Statistics outline pdfs en francais

Core French - Les directions - Directions Unit Outline
*Updated in 2021 to include digital activities for distance learning!*Are you planning a directions unit in your Core French class? This product will help you plan with your end goal in mind, and refine your ideas, so that you can plan activities and lessons that help your students actually function in French. Perfect for teachers who are trying to incorporate CEFR into their classrooms!This 96 page unit plan includes:- Big Ideas - Sample Directions Scenarios - Learning Goal, Success Criteria, S
Subjects:
Grades:
6th - 9th
Types:
Also included in: Authentic Topics Core French Long Range Plans and Units Bundle!

Écrire chaque jour : Le paragraphe de la semaine
Voulez-vous que vos élève écrivent à chaque jour? Avec ce produit, vos élèves passeront par le processus d'écriture à toute les semaines! Ils travailleront le remue-méninge, le plan, le brouillon, la révision/correction ainsi que la copie propre en rédigeant un paragraphe à toute les semaines.
Vos élèves auront besoin d'écrire une phrase d'introduction, trois idées et détails et/ou exemples qui supportent ainsi qu'une phrase de conclusion.
Cette ressource est idéale pour étudier la réponse
Subjects:
Grades:
4th - 7th
Types:
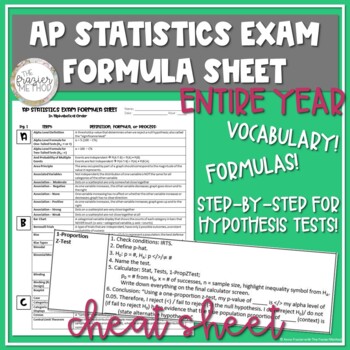
AP Statistics Review Vocabulary & Formulas for Entire Year, AP Stats Cheat Sheet
AN ENTIRE YEAR OF AP STATISTICS VOCABULARY, FORMULAS, & STEP-BY-STEP PROCESSES FOR CONFIDENCE INTERVALS AND HYPOTHESIS TESTS!!! Is AP Stats hard? Not with this all-in-one AP Statistics review of vocabulary, formulas, and step-by-step processes! Need some AP Statistics help? Use this product to help your students review for the AP Statistics Exam! This AP Statistics reference sheet includes definitions, formulas, and step-by-step processes for performing hypothesis tests and creating confiden
Subjects:
Grades:
9th - 12th
Types:
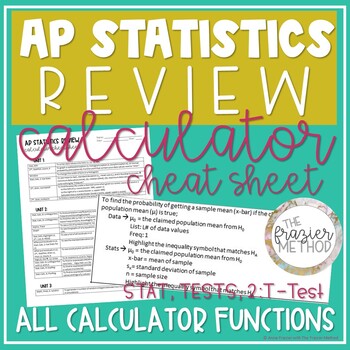
AP Statistics Review - Calculator Cheat Sheet for TI-84 Plus CE on AP Stats Exam
AN ENTIRE YEAR OF STATISTICS CALCULATOR FUNCTIONS for the TI-84 PLUS CE or TI-84 PLUS!!! Is AP Statistics hard? Not with this all-in-one AP Statistics calculator cheat sheet! Use this AP Statistics worksheet of calculator functions to help your students review for the AP Stats Exam! This AP Statistics reference sheet includes calculator functions from Units 1-7 - such as linear regression, probability formulas, graphs, re-expression, confidence intervals hypothesis tests, and more! This is a one
Subjects:
Grades:
9th - 12th, Higher Education
Types:
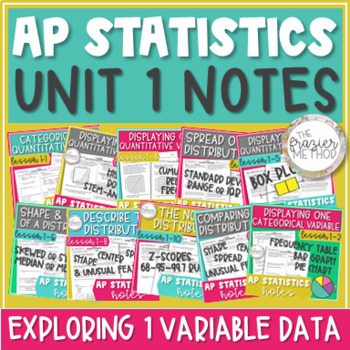
AP Statistics Notes Unit 1 Histogram, Box Plot, Skew, Mean, Normal Distribution
Use these AP® Statistics notes to teach UNIT 1 – EXPLORING ONE-VARIABLE DATA. Histograms, box plots, dot plots, stem-and-leaf plots, bar graphs, outliers, 5-number summary, z-scores, Normal Distribution / Normal Model, and describing a distribution's shape, center, & spread! Skewed or symmetric, median or mean, standard deviation or interquartile range... You can also use these notes for AP® Stats exam review! Aligns with the updated 2019-2020 objectives and standards of Unit 1: Exploring On
Subjects:
Grades:
10th - 12th
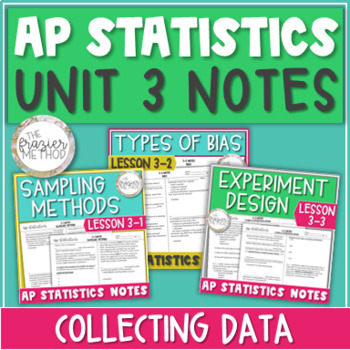
AP Statistics Notes Unit 3 Sampling Methods, Types of Bias, & Experiment Design
AP Statistics notes on SAMPLING METHODS : simple random sample, stratified sample, systematic sample, cluster sample, convenience sample... TYPES OF BIAS : undercoverage, nonresponse bias, response bias... and OBSERVATIONAL STUDIES & EXPERIMENT DESIGN : variables, treatments, control group, placebo, blocking, blinding, matched pairs, and more! Great for AP Stats Exam review! Aligns with AP College Board's updated 2019-2020 objectives and standards for AP Statistics Unit 3: Collecting Data. W
Subjects:
Grades:
10th - 12th, Higher Education
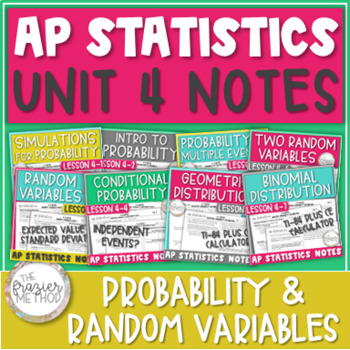
AP Statistics Notes Unit 4 Bundle - Probability Rules & Random Variables
AP Stats notes on PROBABILITY RULES : basic probability, complement, compound probability of multiple events, conditional probability, venn diagrams, simulations... RANDOM VARIABLES : expected value, standard deviation, sum and difference of two... and GEOMETRIC & BINOMIAL PROBABILITY DISTRIBUTIONS! Great for AP Statistics Exam review prep! Aligns with AP College Board's objectives and standards for AP Statistics Unit 4: Probabilities, Random Variables, & Probability Distributions. WHAT’
Subjects:
Grades:
10th - 12th
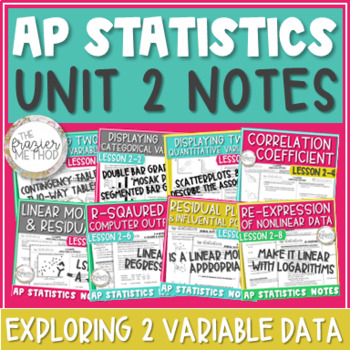
AP Statistics Notes Unit 2 Scatterplot Linear Regression Residual Two Way Table
AP® Statistics notes on UNIT 2 - EXPLORING TWO-VARIABLE DATA : contingency tables / two way tables, segmented bar graphs, scatterplots / scatter plots, correlation coefficient, linear models, residual plots, linear regression computer output, r-squared, and more! Great for AP® Stats Exam review prep! Aligns with updated 2020 objectives and standards for AP® Statistics Unit 2: Exploring Two-Variable Data. WHAT’S INCLUDED IN THIS PRODUCT?2-1 Notes - Contingency Tables2-2 Notes - Segmented Bar Grap
Subjects:
Grades:
10th - 12th
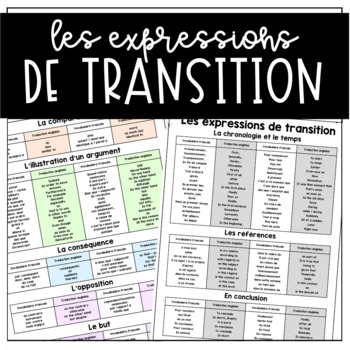
Les mots de transitions (Transition/Linking Words in French Poster)
Bonjour! Welcome to my store!If you're on this page, you may be thinking... How can I help my students become confident and BETTER writers? Look no further..This neat and colourful handout includes transition words translated from French to English. There are over 125 words! All words are categorized for a smoother and easier search for your students. There are 2 different formats (colour and black and white).⭐️ WHAT YOU WILL GET:- 2 Sheets in Black & White- 2 Sheets in Colour⭐️CATEGORIES:-A
Subjects:
Grades:
7th - 12th
Types:
Also included in: Technology, Pollution & Futur Tense French Bundle - (Wall-E inspired)

Écrire une lettre amicale - Écriture créative
Inclut dans ce document:Affiche avec la définition d’une lettre amicaleAffiche avec « Les parties de la lettre amicale »Affiche avec exemples de « Formules d'interpellation »Affiche avec exemples de « Débuts de lettre amicale »Affiche avec exemples de « Formules de politesse amicale »Fiche de l’élève: « Écris les parties de la lettre.”Projet d’écriture avec 3 scénario de lettre à écrireFiche vierge pour écrire une lettre amicaleSUIVEZ-MOI! Autres documents qui vous intéresseraient possiblemen
Subjects:
Grades:
4th - 8th
Types:
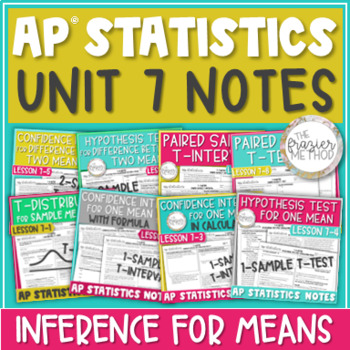
AP Statistics Notes Unit 7 Confidence Intervals & Hypothesis Tests for Means
8 AP® Statistics Notes on CONFIDENCE INTERVALS & HYPOTHESIS TESTS FOR SAMPLE MEANS. Through definitions, examples, and AP Stats FRQs, these notes teach through T-Distribution / T-Model, 1-Sample T-Interval, 1-Sample T-Test, 2-Sample T-Interval, 2-Sample T-Test, Paired Sample T-Interval, and Paired Sample T-Test. Each confidence interval and hypothesis test is taught by-hand with its formula and with its TI-84 Plus CE Calculator function. You can also use this bundle for AP® Statistics Exam p
Subjects:
Grades:
10th - 12th
Types:

Écrire une pièce de théâtre
Ce document imprimable emmène les élèves à travers le processus d'écriture de la création d’une pièce. Vos élèves vont adorer renforcer leurs compétences en écriture en écrivant une pièce de théâtre du avec ce modèle. Dans ce document:9 images de personnages de royauté pour créer des marionnettes sur bâton9 cadres pour créer ses propres personnages pour marionnettes sur bâton3 étiquettes sur lesquelles on peut écrire les noms des personnages pour faire des colliers3 pages de gabarits pour la pl
Subjects:
Grades:
4th - 8th
Types:
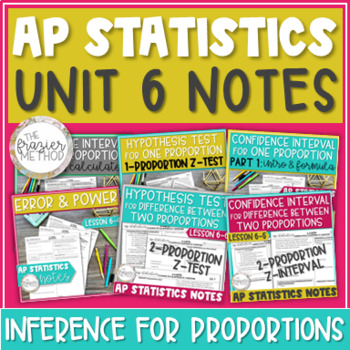
AP Statistics Unit 6 Notes Confidence Interval & Hypothesis Test for Proportions
AP Stats Notes on CONFIDENCE INTERVALS & HYPOTHESIS TESTS FOR PROPORTIONS! 1-Proportion Z-Interval, 1-Proportion Z-Test, Type 1 & 2 Errors, the Power of a Significance Test, 2-Proportion Z-Interval, and 2-Proportion Z-Test... each taught by-hand with its formula and with its TI-84 Plus CE Calculator function. Great for AP Stats Exam prep! Includes AP Stats FRQs! Aligns with AP College Board's updated 2019-2020 objectives and standards for AP Statistics Unit 6: Inference for Categorical
Subjects:
Grades:
10th - 12th
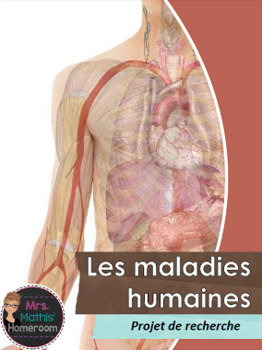
Les maladies humaines - projet de recherche (Research Project on Human Diseases)
Avec ce projet, l’élève démontre ses apprentissages sur les systèmes du corps humain en faisant des recherches sur une maladie courante qui affecte un système du corps et ses organes. L’élève décrit aussi la structure et la fonction de base des principaux organes en plus de décrire la maladie, ses symptômes, ses causes et ses traitements. Afin d’encourager la différentiation, l’élève a le choix du sujet et de la façon de présenter ses trouvailles.
Voici ce qui est inclus dans cette ressourc
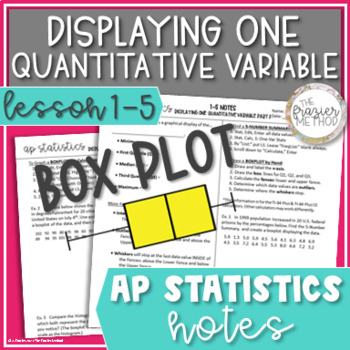
AP Statistics Notes Box Plot / Boxplot, Quartile, IQR, Outlier, 5 Number Summary
AP Stats notes to teach or review BOXPLOTS / BOX PLOTS / BOX-AND-WHISKER PLOTS! Define & calculate the median, interquartile range, 5-Number Summary, minimum, maximum, first quartile (Q1), third quartile (Q3), and percentiles for a set of data. Also, determine which data values are outliers based on the upper fence and lower fence of a boxplot. Students will graph box plots by hand given just a few of the data values and with step-by-step TI-84 Plus CE Calculator directions given the full li
Subjects:
Grades:
9th - 12th
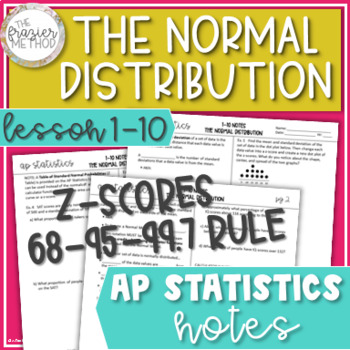
AP Statistics Notes Normal Distribution Z-Scores Empirical Rule Normal Model
Great AP Stats notes on the NORMAL DISTRIBUTION & Z-SCORES! Students will use the Normal Model and Empirical Rule (68-95-99.7% Rule) to find a data value, calculate z-scores, and find the area under the Normal curve using both the z-score formula and TI-84 Plus CE calculator functions. Students will also interpret z-scores in context, write the Normal Model notation N(µ, σ), and determine whether a data value can be considered “unusual.” Perfect for AP Stats Exam review prep! Aligns with AP
Subjects:
Grades:
9th - 12th

Paragraphe descriptif (Ugly Christmas Sweater Descriptive Paragraph in French)
Un chandail laid de Noël (ou d'hiver) fait souvent partie de nos traditions! Célébrez-vous avec une journée thème à l'école? Avec cette activité d'écriture et de dessin, vos élèves auront du plaisir à faire le design d'un chandail laid et à écrire un paragraphe descriptif à son sujet, tout en suivant les étapes du processus d'écriture.
Inclus:
- page de design pour le chandail
- banque de mots descripteurs
- organisateurs graphiques pour la planification
- pages d'écriture pour le brouillon
Grades:
3rd - 6th
Types:
AP Statistics Notes Compound Probability of Multiple Events & Mutually Exclusive
AP Statistics notes on COMPOUND PROBABILITY OF MULTIPLE EVENTS / AND & OR PROBABILITY RULES with VENN DIAGRAMS and Mutually Exclusive Events! Students will define and calculate the probability of Events A AND B, the probability of Events A OR B, and the probability of an event’s complement. Students will also determine whether events are MUTUALLY EXCLUSIVE. Use these notes pages as AP Stats Exam review prep! Aligns with AP College Board's objectives and standards for AP Statistics Unit 4: Pr
Subjects:
Grades:
10th - 12th
Also included in: AP Statistics Notes Unit 4 Bundle - Probability Rules & Random Variables
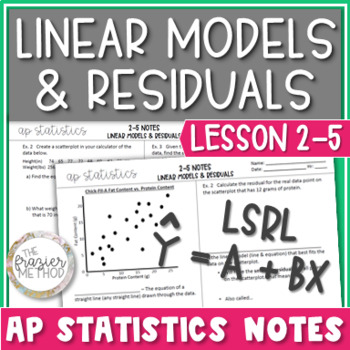
Linear Models & Residuals / Regression Line of Best Fit - AP Statistics Notes
AP Stats Notes on LINEAR MODELS & RESIDUALS. Write the equation of a linear regression model from a list of data values and use step-by-step TI-84 Plus CE Calculator directions to find the equation of the Line of Best Fit / Least Squares Regression Line (LSRL). With formulas and the regression equation, calculate residuals (e), predicated values (y-hat), y-intercept, & slope of the linear model. Templates for “interpret in context” questions are also included! Great AP Stats Exam prep! A
Subjects:
Grades:
10th - 12th

Mon sondage: un projet de traitement de données (Survey Project in French)
Voici une tâche d'évaluation amusante pour terminer votre unité sur les traitements de données. En suivant des consignes guidées étape-par-étape, l'élève prépare une question de sondage, un tableau des effectifs et un diagramme à bandes. Il trouve ensuite le mode, la médiane et l'étendue des données, puis tires des conclusions. Une grille d'évaluation est aussi incluse.
Vous seriez peut-être aussi intéressé dans ces autres jeux de mathématiques en français :
J'ai, qui a: les nombres écrits
Subjects:
Grades:
3rd - 5th
Types:
AP Statistics Notes Histograms, Dot Plots, & Stem-and-Leaf Plots - Data Displays
AP Stats notes to teach or review graphing and reading DOT PLOTS, STEM-AND-LEAF PLOTS, & HISTOGRAMS! Students will graph histograms using a TI-84 Plus CE Calculator and graph a dot plot and stem-and-leaf plot by hand. Practice problems and examples include answering questions about a set of data values displayed in a histogram. Great for AP Stats Exam prep! Aligns with AP College Board's updated 2019-2020 objectives and standards for AP Statistics Unit 1: Exploring One-Variable Data. WHAT’S
Subjects:
Grades:
9th - 12th
AP Statistics Notes - UNIT 5 BUNDLE - Sampling Distributions Proportions & Means
These AP Statistics notes will help you teach or review SAMPLING DISTRIBUTIONS FOR SAMPLE PROPORTIONS & SAMPLE MEANS! You can also use these notes pages to help your students review for the AP Statistics Exam! Aligns with AP College Board's objectives and standards for AP Statistics Unit 5: Sampling Distributions. WHAT’S INCLUDED IN THIS PRODUCT?5-1 Sampling Distributions of Sample Proportions2 Pages, Blank Pages & Answer KeyIntroduces sampling distributions and sampling distributions of
Subjects:
Grades:
10th - 12th
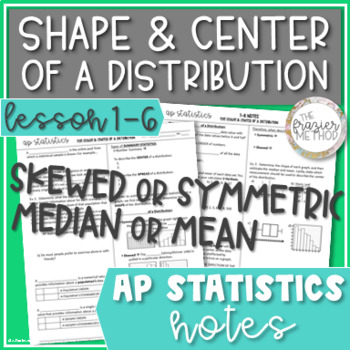
AP Statistics Notes Shape & Center of Distribution, Median Mean, Skew Symmetric
Here's AP Stats notes on SHAPE & CENTER OF A DISTRIBUTION – SYMMETRIC OR SKEWED, MEDIAN & MEAN! Calculate the median and mean from a list of data values and estimate the median and mean from a histogram, boxplot, stem-and-leaf plot, dot plot, and cumulative relative frequency plot. Determine which measure of center to use based on the shape of the distribution – skewed or symmetric. Other terms defined in these notes include sample, population, statistics with symbols, parameters with sy
Subjects:
Grades:
9th - 12th
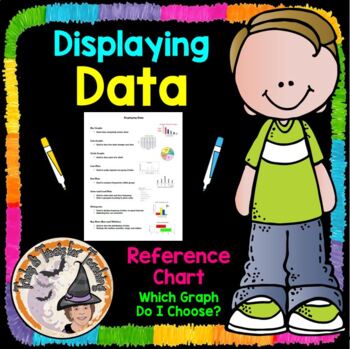
Displaying Data Reference Chart Notes Which Graph Do I Choose?
Math Teachers ~ You'll LOVE this Displaying-Data, Which-Graph-Do-I-Choose? Data-Display Reference-Chart will be SUPER helpful to your students in helping them determine which graph to choose, and provides a quick visual picture to remind them what that particular graph looks like. I printed one of these for each of my students to put inside their Math Toolkit Notebook, to use as a Reference for Data Displays Charts and Graphs. You'll enjoy using this year after year!Be sure to L@@K at my other 1
Subjects:
Grades:
5th - 8th
Showing 1-24 of 247 results


