256 results
Elementary statistics resources for Microsoft PowerPoint under $5
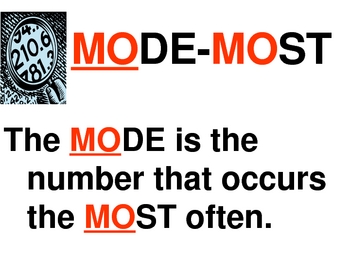
Statistics Mean, Median, Mode & Range Interactive PowerPoint by Erica
Introduce statistics including mean, median, mode and range with this colorful, interactive 22 slide PowerPoint. This interactive PowerPoint introduces each term and teaches a strategy for finding the value. There is also a trick or visual to help students remember the steps to find each one (mean, median, mode and range). Students are able to practice finding the mean, median, mode and range and then check within the PowerPoint. This is excellent for a statistics lesson or for students to e
Subjects:
Grades:
3rd - 6th
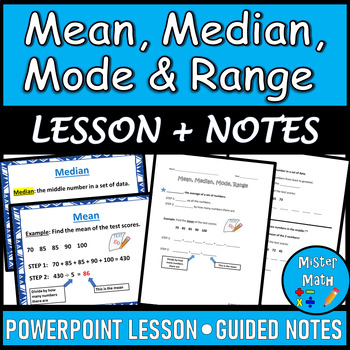
Mean, Median, Mode & Range PPT and Guided Notes BUNDLE
This Mean, Median, Mode & Range BUNDLE includes a PowerPoint Lesson and a corresponding Guided Notes Packet to assist students in learning about finding the mean, median, mode, and range of data sets. The PowerPoint and Guided Notes packet include key vocabulary, as well as an example for each skill. Additional practice problems are included that ask students to find the mean, median, mode and range of four data sets (for a total of 16 extra practice problems!) The presentation also comes fu
Subjects:
Grades:
3rd - 6th

Box and Whisker Plot PPT and Guided Notes 6.SP.2 , 6.SP.4 , 6.SP.5
Box and Whisker Plot
This PPT lesson teaches students the vocabulary that goes with box and whisker plots as well as the steps for creating a box and whisker plot.
Along with the PPT are guided notes where students can answer questions while watching the PPT as well as the answer key. They also have the chance to create their own box and whisker plot. This is a great introductory lesson. This matches Common Core Standards for 6th grade, but could be adapted and used for other grades as we
Subjects:
Grades:
5th - 8th
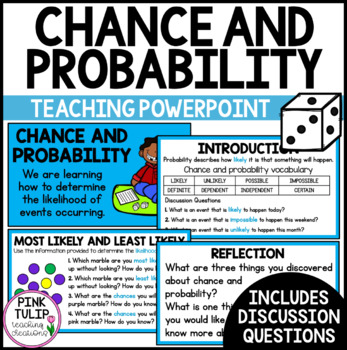
Chance and Probability - Teaching PowerPoint Presentation
Chance and Probability - Teaching PowerPoint PresentationCurriculum aligned PowerPoint presentation to guide explicit teaching of chance and probability, including likelihood. Includes:Learning intention.Introduction (tune in). Engaging graphics.Detailed explanations of various chance events.An in-depth vocabulary of terms such as likelihood, probability, chance, independent, dependent, and impossible.Discussion questions with answers.Reflection slides.Glossary. US spelling and UK spelling vers
Subjects:
Grades:
3rd - 5th
Also included in: Math PowerPoint Presentations Bundle
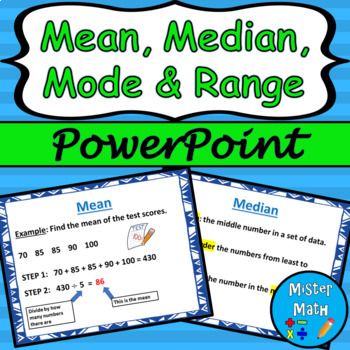
Mean, Median, Mode & Range PowerPoint Lesson
This is a PowerPoint Lesson to assist students in learning about finding the mean, median, mode, and range of data sets. The PowerPoint includes key vocabulary, as well as an example for each skill. Plenty of real-life examples are included to give students ample opportunities to connect the skills to the real world. The presentation also comes fully animated, with animations triggered by mouse click (or presentation pointer!)This PowerPoint lesson is also part of a BUNDLE that includes a guided
Subjects:
Grades:
3rd - 6th
Also included in: Mean, Median, Mode & Range PPT and Guided Notes BUNDLE
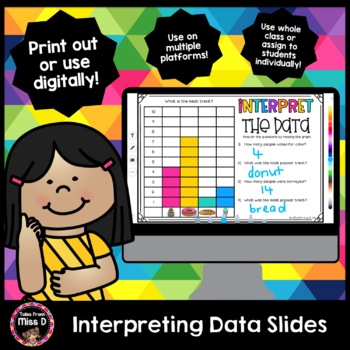
Interpreting Data Slides
Help develop students' ability to collate data and interpret graphs with these slides.There are two styles of questions;Tally - students count the data and use tally marksInterpret a Graph - students read the graph and answer questionsThese slides can be printed out, used in the classroom with your students or uploaded into your digital classroom for distance learning.Have a question? Use the Product Q & A or email me at talesfrommissd@gmail.comRelated ProductsSpin and GraphSight Word Spin a
Subjects:
Grades:
K - 2nd
Types:

Mean, Median, Mode, Range Scavenger Hunt Around the World Escape Room Earth Day
Digital Earth Day Math statistics activity to practice calculating the measure of central tendency including mean, median, mode, and range. This Adventure Math Escape Room is EDITABLE in Google Slides™ or PowerPoint™. Students have to visit all places pinned on the Earth map to find riddles.They have to solve tasks along the way to get the final code. Students must enter this code going to the Earth's core to win.This is a self-checking activity. The recording sheet in Google Sheets™/Excel™ is i
Subjects:
Grades:
5th - 8th
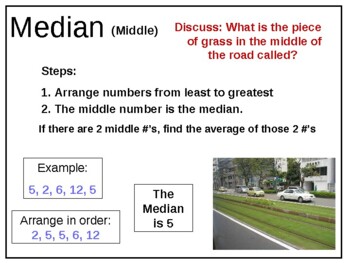
4th 5th 6th Grade Math Mean Median Mode Range MMMR Data Gr 4 5 6 Whole Numbers
This 16-slide Math PowerPoint introduces Mean, Median, Mode and Range and gives hints on how to remember each term. There are numerous practice problems as well. The numbers (data) used may be smaller than you desire, but the numbers are easily changeable and you'll still be able to use the examples. The last slide gives directions for a game to practice Mean, Median, Mode and Range using playing cards.
Subjects:
Grades:
4th - 6th
CCSS:
Mean, Median, Mode, and Range (PowerPoint Only) - Distance Learning
Mean, Median, Mode, and Range - This is an enjoyable, interactive, and engaging PowerPoint covering mean, median, mode, and range (and introduces outliers). This presentation is great for 5th and 6th graders and 7th graders who struggle with these concepts.Included in this Lesson:PowerPointAnimated and fun 4-part, 21-slide PowerPoint (multi-day use)-Part 1 – The Meaning of Mean-Part 2 – Getting in the Middle of Median-Part 3 – Making the Most of Mode-Part 4 – Home, Home on the RangeEach section
Subjects:
Grades:
5th - 7th
Types:

Stem and Leaf
Stem and Leaf Plots: This Stem and Leaf Presentation also includes Frequency Tables and Dot Plots appropriate for 4th grade TEKS Math standards. Stem and Leaf Plots are often very difficult for students to understand. This Stem and Leaf PowerPoint carefully constructs the key concepts for students to understand and develop new understandings. It also shows a visual comparison of Stem-and-Leaf Plots to Frequency Tables and Dot Plots. It contains examples of data using fractions and decimals t
Subjects:
Grades:
4th
6th Grade Math Probability & Statistics-Statistical vs Non-Statistical Questions
This lesson focuses on asking Statistical vs Non-Statistical Questions. This lesson provides instruction and learning opportunities where students evaluate whether statements can be tested using statistics. Math CCSS 6.SP.1 is the focus - Recognize a statistical question as one that anticipates variability in the data related to the question and accounts for it in the answers. For example, “How old am I?” is not a statistical question, but “How old are the students in my school?” is a statisti
Subjects:
Grades:
5th - 7th
CCSS:
Also included in: 6th Grade Math -Probability and Statistics Bundle
Mean Median Mode Range with Outliers
This PowerPoint Presentation was made for my Pre-Algebra class, but can easily be adapted for lower grades. The lesson teaches students how to solve for mean, median, mode and range along with how to identify outliers within a set of data (as well as their effects on a data set). Through analytical thinking, students can decipher how to find the measure of central tendency (which average best describes the data set).
This presentation has 50 slides with lots of examples and practice problems.
Subjects:
Grades:
5th - 7th
Data and Statistics Jeopardy
Data and Statistics Jeopardy Review Game!Fabulous review game going over geometry and unit conversions!*Game includes 5 topics (Dot Plot - Box Plot - Histograms - Mean Median Mode and Range - Miscellaneous) with 5 questions each, as well as a challenging final Jeopardy question! Miscellaneous sections include more review of the other four sections as well as statistical questions.*Numbers disappear as you go for easy tracking of which questions you have done already.-Hits perfectly with 6th grad
Subjects:
Grades:
5th - 7th
Also included in: 6th Grade Math Review Jeopardy - 8 Unit Bundle
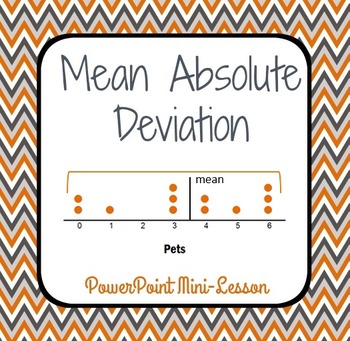
Mean Absolute Deviation - PowerPoint Mini Lesson Introduction
This PowerPoint mini-lesson introduces your students to the concept of the Mean Absolute Deviation (M.A.D.). It's presented in kid-friendly language, and it walks your students through the process, one step at a time. Most of the calculations use nice, whole numbers. The visual models will help your students understand the concept while they calculate this measure of variation.Check out the Preview file, so you understand what you're receiving on these 15 slides.Want a follow up activity here
Subjects:
Grades:
5th - 6th
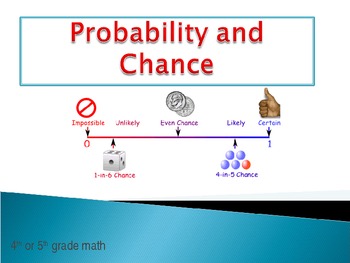
Probability and Chance Powerpoint using candy, dice, spinners and more
Probability and Chance:
This Powerpoint includes definitions, examples, descriptions, and multiple choice questions.
It also includes slides for guided practice using M&Ms.
Subjects:
Grades:
3rd - 6th
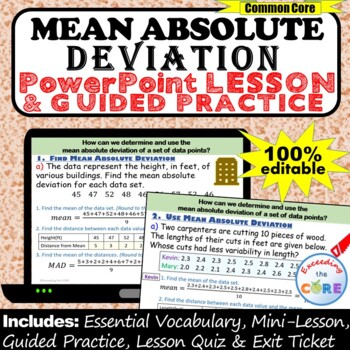
MEAN ABSOLUTE DEVIATION (MAD) PowerPoint Lesson & Practice | Distance Learning
Great for online learning and distance learning!Get your students successfully finding the MEAN ABSOLUTE DEVIATION (MAD) with this PowerPoint Presentation. This lesson begins with a focused mini-lesson and guided practice questions. It concludes with a lesson quiz and exit ticket to assess student understanding. All of the answers are included. This PowerPoint presentation is 100% editable, therefore you can modify any slide as needed.What is Included:_ Mini-Lesson with Guided PracticeThe mini-
Subjects:
Grades:
5th - 7th
Ratios- 2 Truths, 1 Lie
This product contains LOTS of options:
- Power Point Presentation with sound effects and answer available on click
- PDF version of the PPT with two copies of each slide- the second containing the answer (in case you don't own the fonts and don't want to purchase them)
- PPT turned into Task Cards (great for centers or SCOOT!)
- Answer Sheet to use with PPT or Task Cards
Skills Covered:
Identify the ratio given a picture, find equivalent ratios, interpret data from a table in order to name a
Subjects:
Grades:
4th - 7th
Psychology Random Sample Population Stats M&M Worksheet for Research Methods
Psychology or Statistics Random Sample & Population Statistics M&Ms Worksheet Activity for Research Methods includes a teacher direction sheet with materials that you need and how to complete the activity along with printable handout for students. *Student Favored activity*Please email me with any questions at ReadySetLearnSocialScience@yahoo.comIf you would like to get updates on NEW and CURRENT resources...►FOLLOW Me on Teachers Pay Teachers►FOLLOW Me on Pinterest►FOLLOW Me on Instagr
Subjects:
Grades:
4th - 12th, Adult Education
Types:
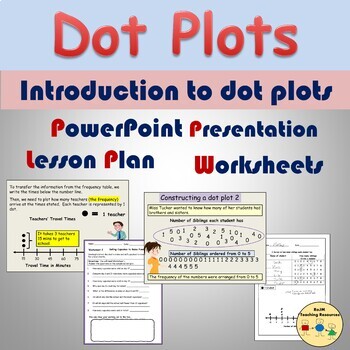
Dot Plots Line Plots Worksheets Presentation Frequency Tables Statistics
This resource relates to statistics on the topic of dot plots. It introduces dot plots on PowerPoint (12 Slides). The presentation demonstrates how the data was collected, rearranging data in numerical order, and presenting the data on a frequency table. Using the information on the frequency table, students are shown how to create a dot plot/line plot via Slide Show animation. Two detailed examples are shown. Content:· PowerPoint Presentation (12 Slides)· 1 Flexible Lesson Plan (1- 2 hrs)· 2 Se
Subjects:
Grades:
3rd - 5th
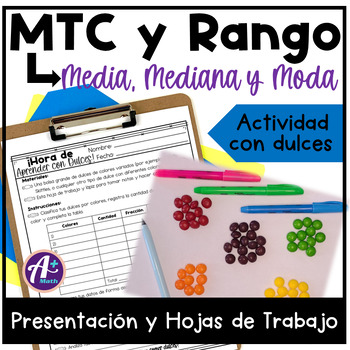
Medidas de Tendencia Central y Rango - media, mediana y moda
Medidas de Tendencia Central y Rango - Analizar DatosEste recurso trabaja los siguientes temas:MediaMedianaModaRangoAnalizar DatosEl recurso incluye:•Presentación en PowerPoint y PDF - 27 diapositivas con explicaciones y ejemplos•5 hojas de trabajo - Incluye la clave de respuestas•1 hojas de trabajo - Actividad con Dulces Cualquier duda, pregunta o sugerencia escríbeme en diana@aplusmathbydianaaviles.com.Recuerda dejar una reseña de este recurso y seguir mi tienda en este enlace: A Plus Math by
Subjects:
Grades:
5th - 8th
Statistics, Probability, and Data Slide Show for Grades 3 and 4
The vocabulary and concepts included are sets, data, survey, tally, charts, diagrams, graphs, key, mean, probability, combinations, and tree diagrams.The 49 PowerPoint slides are a combination of teaching (lecture style) and interactive slides (matching, fill-in, multiple choice, etc).Also included is a Directions Page for using PowerPoint and for using the PEN OPTION of PowerPoint.The Preview File is pages 1-11 of the Slide Show so that you can "Try before you Buy".~~~~~~~~~~~~~~~~~~~~~~~~~~~~~
Subjects:
Grades:
3rd - 4th
Also included in: Math for Grades 3-4 PowerPoint Slide Show BUNDLE Math Vocabulary

Probability Jeopardy
Probability of Single/ compound Events. Includes a Final Jeopardy riddle, Vocabulary and Word problems based on the new TEKS. Help students Prepare for tests, STAAR and lessons by playing this interactive Jeopardy game that covers most Probability topics.
Subjects:
Grades:
5th - 8th
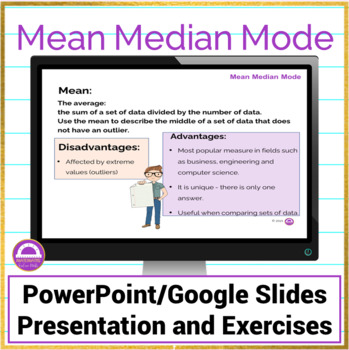
Mean Median Mode Notes and Activities
Make teaching Mean Median and Mode easy with this super engaging digital Teacher Presentation and printable Student notes! Perfect for both In Person and Distance Learning, this resource has everything you need to give your students a solid foundation with examples and class practice exercises during the presentation.This resource includes:Teacher Presentation in both Google Slides and PowerPoint that provides colorful visuals illustrating concepts along with examples;A pdf greyscale version of
Subjects:
Grades:
5th - 8th
Also included in: Bundle Statistics and Probability | 50% Discount
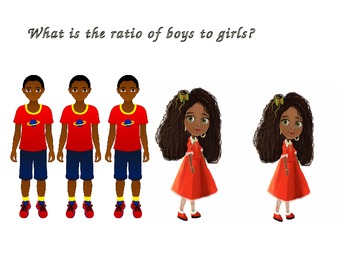
Ratios & Proportional Relationships Powerpoint 6.RP.A.1
Ratios are so much fun! Introduce ratios and proportional relationships with this fun powerpoint. Students can also complete the worksheet that goes along with this activity. Check out my store for the worksheet that is differentiated according to student's ability.
Subjects:
Grades:
5th - 7th
Showing 1-24 of 256 results


